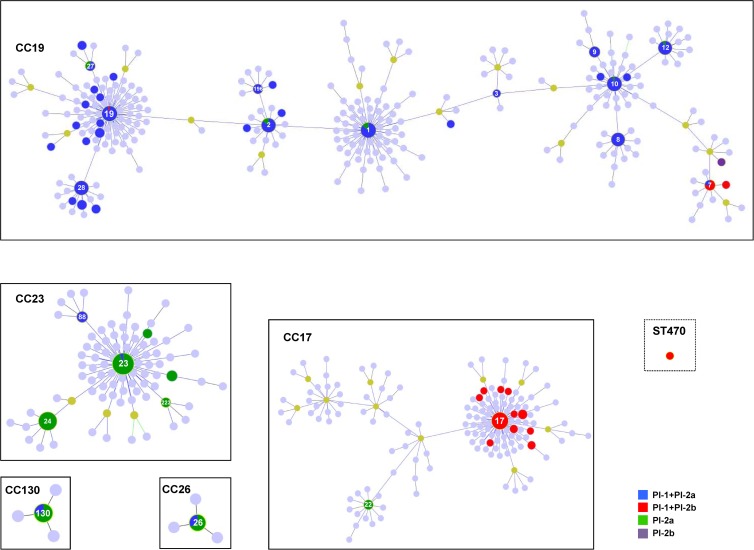
Fig 1.
goeBURST diagram of PI distribution among the GBS isolates characterized by MLST (n = 440). Light-blue and light-green circles indicate STs that are not present in the collection analyzed but that could be found in the Pubmlst database; the latter were identified as subfounders. CCs are identified by the number of the putative founder ST identified by goeBURST. Within each CC, the STs present within our collection are represented in dark blue, red, darker green, and purple, with the size of the circles being proportional to the number of isolates (in a logarithmic scale). The figure was prepared using the PHYLOViZ software (http://www.phyloviz.net/).

