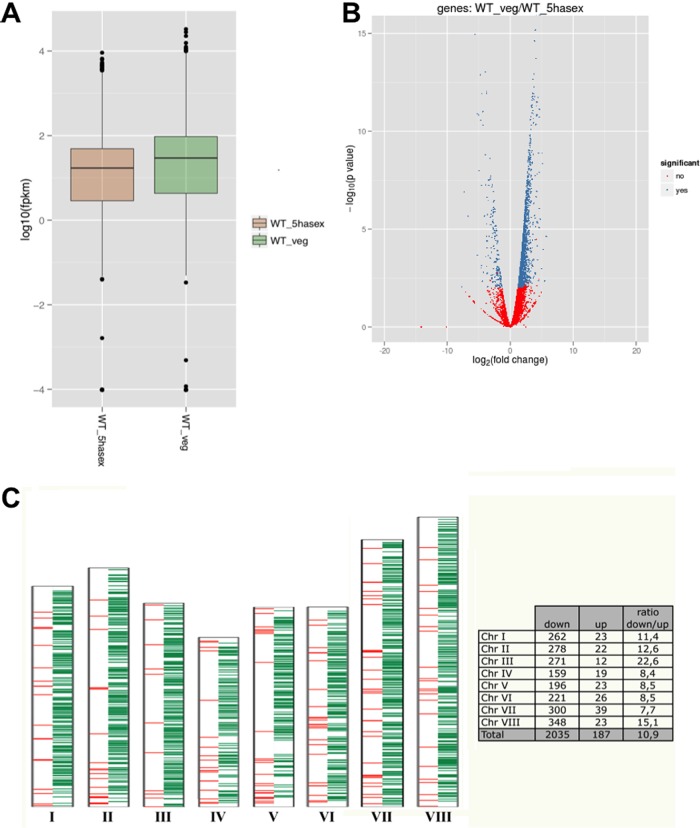
Fig 2.
Summary of the RNA-seq data set. (A) Box plot (csBoxplot software program) showing the distribution of the FPKM (fragments per kilobase of exon per million fragments mapped) values. (B) Volcano graph showing differentially (in blue) and nondifferentially (in red) expressed genes. Values of >0 correspond to downregulated genes, while values of <0 correspond to upregulated genes. (C) Schematic representation showing the location of significantly upregulated (in red) and downregulated (in green) genes in each Aspergillus nidulans chromosome.

