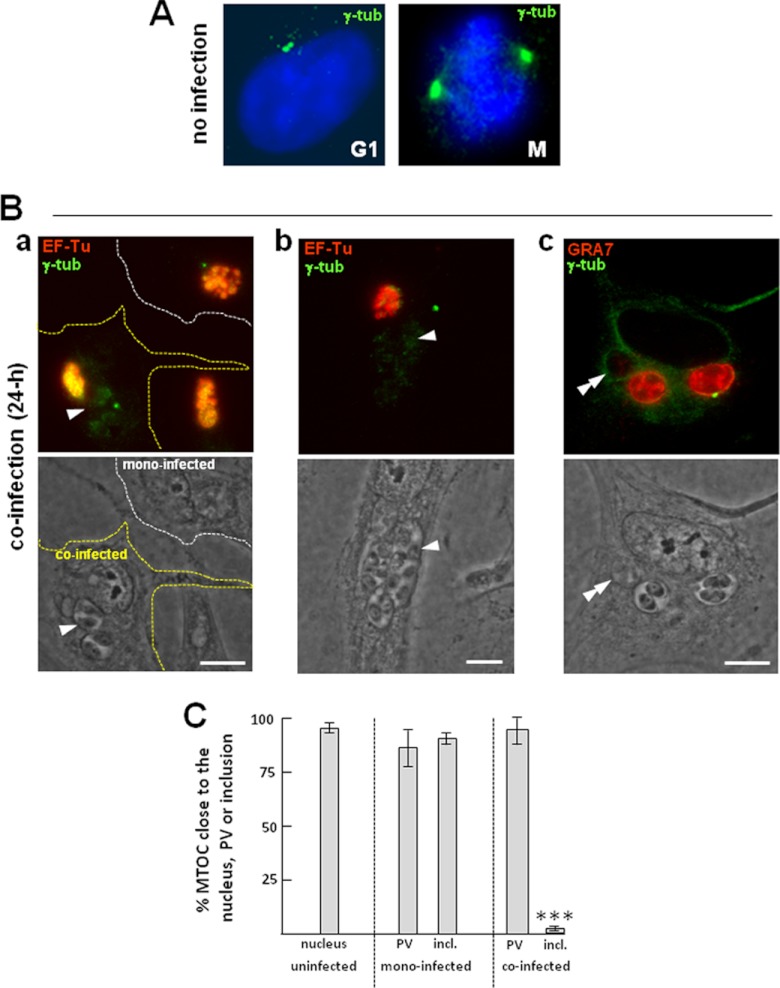
Fig 6.
Relocation of the host MTOC in coinfected cells. (A) IFA of uninfected fibroblasts showing the subcellular location of the MTOC stained for γ-tubulin (green), which is apposed to the nuclear envelope during interphase (G1) and mitosis (M). (B) IFA of Toxoplasma- and Chlamydia-infected fibroblasts. HFFs were stained for γ-tubulin, and the parasites and bacteria were identified by immunostaining for GRA7 and EF-Tu, respectively. (a) A monoinfected cell and a coinfected cell (delineated by white and yellow dashed lines, respectively), allowing comparison of the distribution of the host MTOC in cells infected with Chlamydia alone and in cells infected with the two pathogens for 24 h; (b and c) the MTOC nearest the largest PV. Single and double arrowheads point to the PV and the inclusion, respectively. Bars, 10 μm. (C) Measurement of the spatial distribution of the MTOC relative to the nucleus in uninfected cells and to the PV and inclusion in infected cells. The bars represent the percentage of MTOCs that are ≤1 μm from either the nucleus in uninfected cells or the PV and the inclusion (incl.) in mono- or coinfected cells. Data are means ± SDs of 3 independent assays, with 80 to 100 vacuoles counted in each experiment (***, P < 0.001).

