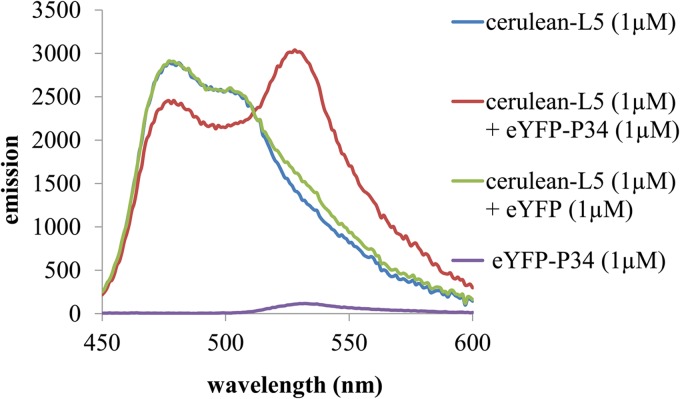
Fig 2.
Cerulean-L5 and eYFP-P34 associate, as demonstrated by FRET. Shown are fluorescence emission spectra (excitation, 400 nm) demonstrating FRET between 1 μM cerulean-L5 and 1 μM eYFP-P34 fusion proteins (red), emission of the individual components at this concentration (blue and purple), and the emission of 1 μM cerulean-L5 plus 1 μM eYFP (green). This assay was repeated three times with three different preparations of recombinant proteins.

