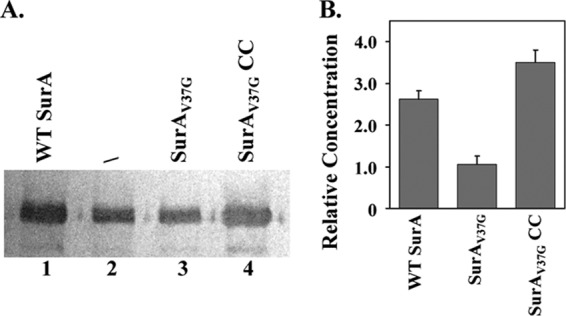
Fig 6.

OmpA expression levels in different strains. (A) A representative blot of anti-OmpA Western blotting of outer membrane vesicles extracted from strain BW25113ΔsurA containing the empty vector (/; lane 2) or a plasmid encoding WT SurA (lane 1), SurAV37G (lane 3), or SurAV37GCC (lane 4). (B) The OmpA relative expression level was obtained from the ratio of band intensities between lanes 1 and 2 (WT SurA), lanes 3 and 2 (SurAV37G), or lanes 4 and 2 (SurAV37G CC). The average values and standard deviations from three measurements are shown.
