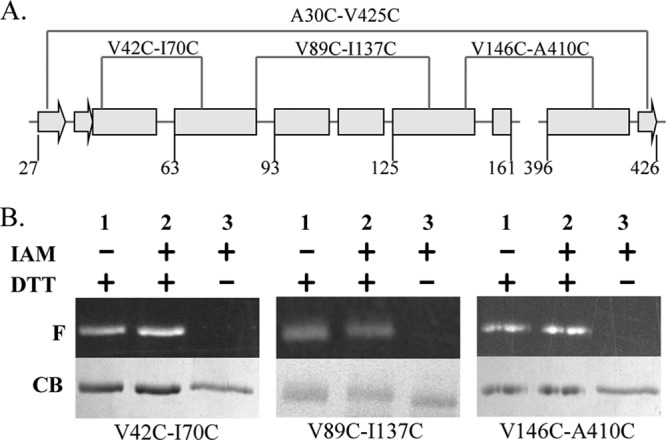
Fig 7.

(A) Secondary structure scheme of the NCt domain of SurA with the position of disulfide bonds shown. Arrows and rectangles denote β-strands and α-helices, respectively. (B) Fluorescent image (F) and Coomassie blue (CB) stain of three SurA cysteine pairs mutants after fluorescent labeling. Lane 1 and lane 3 were positive and negative controls, respectively, which were used to quantify the extent of disulfide bond formation (see the text).
