Fig 6.
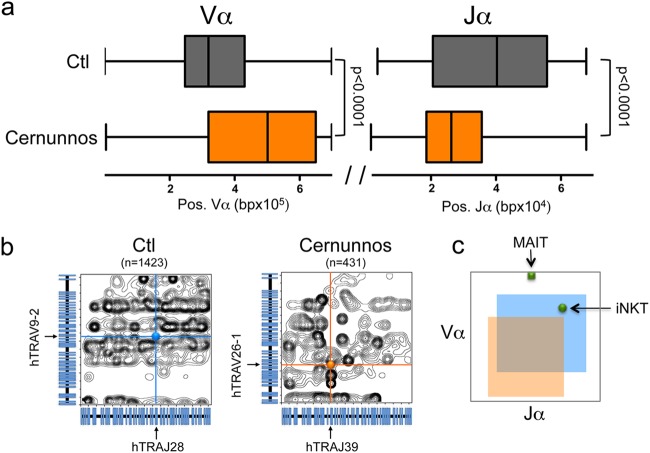
TCR-α repertoire in a human Cernunnos patient. (a) Box-and-whisker representation of Vα and Jα usage in TCR-α transcripts from one Cernunnos patient and one control individual as determined by 5′RACE PCR and NGS. Each VαJα transcript (orange and gray areas for the Cernunnos patient and the control individual, respectively) is positioned according to the relative locations (in bp) of its Vα and Jα elements in the genome. (b) Contour plot representation of TCR-α transcripts from a Cernunnos patient (431 sequences) and a control individual (1,423 sequences). Blue and orange bullets represent the VαJα barycenter in each case. (c) Boxes representing 75% of TCR-α transcript sequences for a Cernunnos patient (orange square) and a control individual (blue square). The two green bullets represent the theoretical positions of TCR-α chains from iNKT (hTRAV10, at bp 2.0 × 10⁵; and hTRAJ18, at bp 5.0 × 10⁴) and MAIT (hTRAV1.2, at bp 0.2 × 10⁵; and hTRAJ33, at bp 3.3 × 10⁴) cells, respectively.

