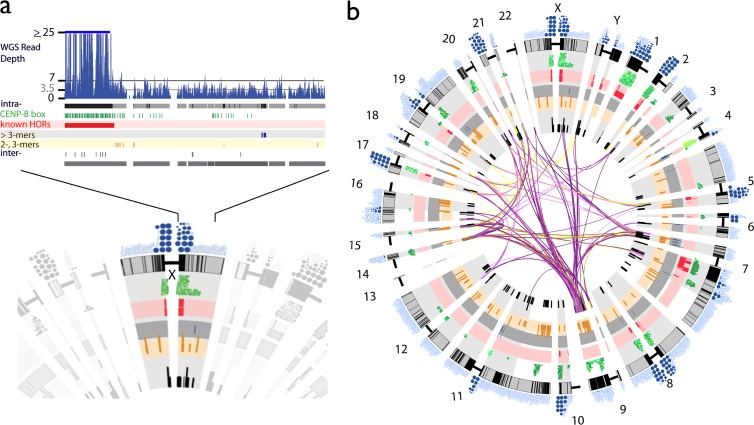
Fig 2.
Alpha satellite annotation in the human genome assembly. (a) As illustrated for the centromeric region on the X chromosome, all full-length alpha satellite monomers are characterized by sequence identity to all other assembled monomers, resulting in a database of homogenization relationships (intra- and/or interchromosomal), local multimonomer homogenization patterns (typical of higher-order repeats [HORs]), the presence and density of CENP-B boxes, and the estimated read depth from HuRef WGS global alignments. Monomers are represented as single-tick boxes and are linearly arrayed relative to the order on the chromosome assembly spanning either side of the centromere gap (shown as the compressed bar). Pericentromeric regions (defined operationally as 2 Mb around the centromere-assigned clone gap) (28, 46) are highlighted in gray. Homogenized alpha satellite monomers (defined as ≥95% identical to another assembled monomer) are shown in black. Local, intrachromosomal homogenization patterns are represented in red (previously known HORs), blue (newly defined HORs containing >3 monomers), and yellow (newly defined HORs containing 2 or 3 monomers). CENP-B boxes are indicated in green, with darker greens signifying an identical match to the published alpha satellite CENP-B box consensus motif and lighter colors indicating relative divergence. (b) Monomers that show interchromosomal homogenization patterns are shown as connections, with the color indicating the number of monomers (or “block” of monomers) that share identity across chromosomes (purple indicates ≥5 monomers within the 1-kb window, light purple indicates ≥4, yellow indicates ≥3, and black indicates <3).

