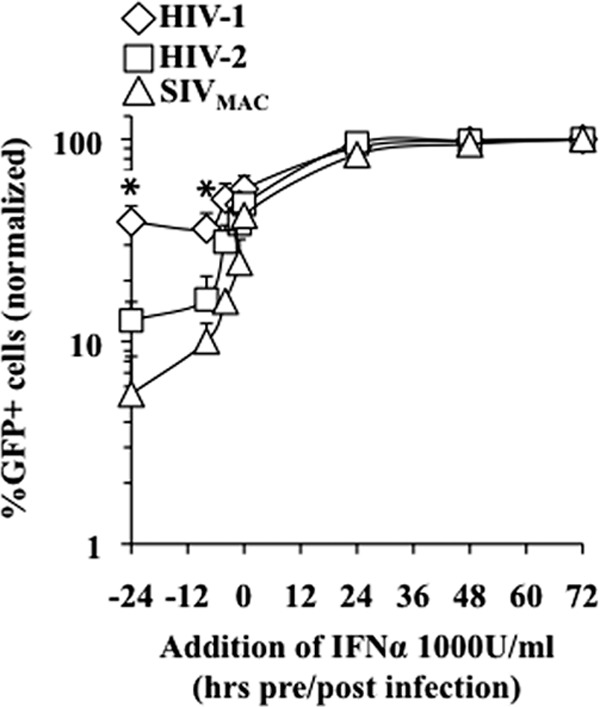
Fig 6.

Kinetics of the induction of the differential antiviral effect of IFN-α during the early phases of infection. Macrophages were treated with 1,000 U/ml of IFN-α at the indicated times pre- and postinfection. The extent of infection was assessed by flow cytometry 3 days afterward. The graph presents data normalized to data from non-IFN-treated infections set to 100% (from 4 independent experiments and with cells of 4 different donors). The asterisk indicates a P value of ≤0.05 according to an unpaired Student t test between HIV-1-infected and HIV-2- or SIVmac-infected cells after IFN-α stimulation.
