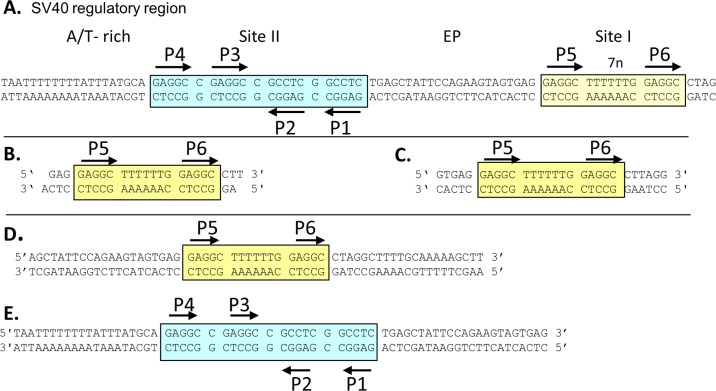
Fig 1.
(A) DNA sequence of the core origin of replication and the site I regulatory region. Site II is indicated by a cyan box, and site I is indicated by a yellow box. Black arrows indicate both the positions and the orientations of the GAGGC pentameric sequences. The locations of the AT-rich and EP regions are also indicated. (B) Site I-containing oligonucleotide used to determine the OBD-site I costructure. Note that the oligonucleotide has a 1-bp overhang; this is commonly used to promote formation of a pseudocontinuous helix within the crystal. (C) Twenty-eight-base-pair site I-containing oligonucleotide used in the ITC studies. DNA substrates used in the EMSAs included the 59-bp site I-containing oligonucleotide (D) and the 64-bp core origin oligonucleotide (E).

