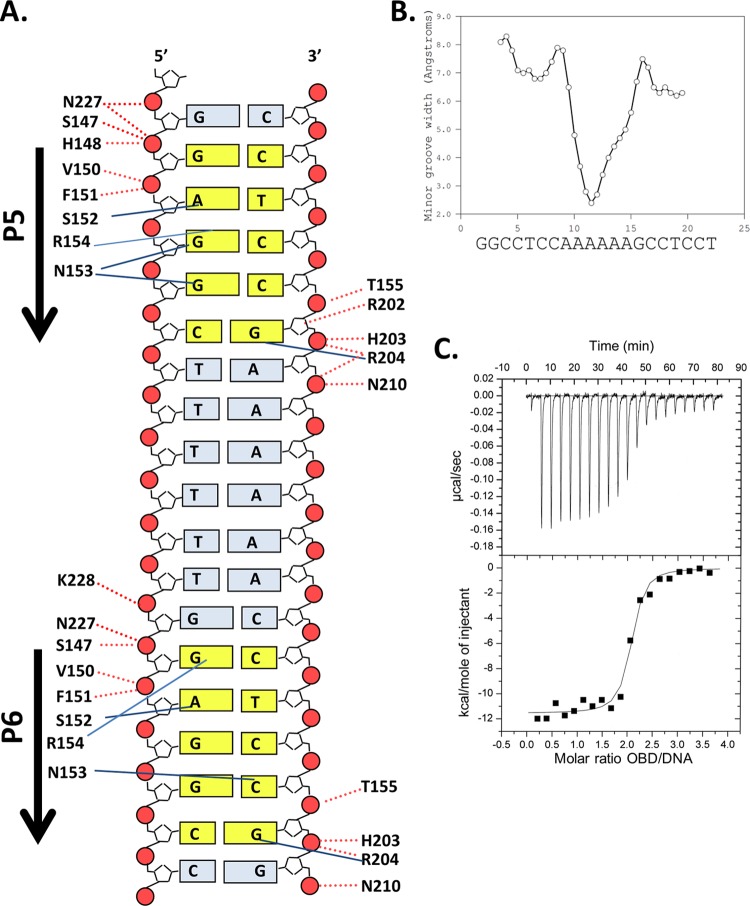
Fig 3.
Set of interactions between the T-ag OBD and site I and related biophysical data. (A) Schematic of the protein-DNA interactions. Dashed red lines indicate interactions with the phosphate backbone; solid blue lines indicate base-specific interactions. Residues from the A1 motif extend between residues 147 and 159, while those from the B2 motif extend between residues 203 and 207. (B) Analysis of DNA structure within the complex. The minor groove width is shown on the y axis; the DNA sequence is presented on the x axis. (C) ITC-based measurement of the thermodynamic parameters for the interaction of the T-ag OBD with site I. The 28-bp duplex DNA used in these experiments, used at a concentration of ∼1.5 μM, is presented in Fig. 1C. Titration of the T-ag OBD into the site I-containing oligonucleotide took place at 25°C in reaction buffer (Materials and Methods). The protein concentration in the syringe was ∼37.5 μM. The actual calorimetric trace is shown in the top panel. The y axis of the isotherm is power in μcal/s; the x axis is time in minutes. The stoichiometry and association constants were determined from curve fitting the integrated calorimetric trace presented in the bottom panel.

