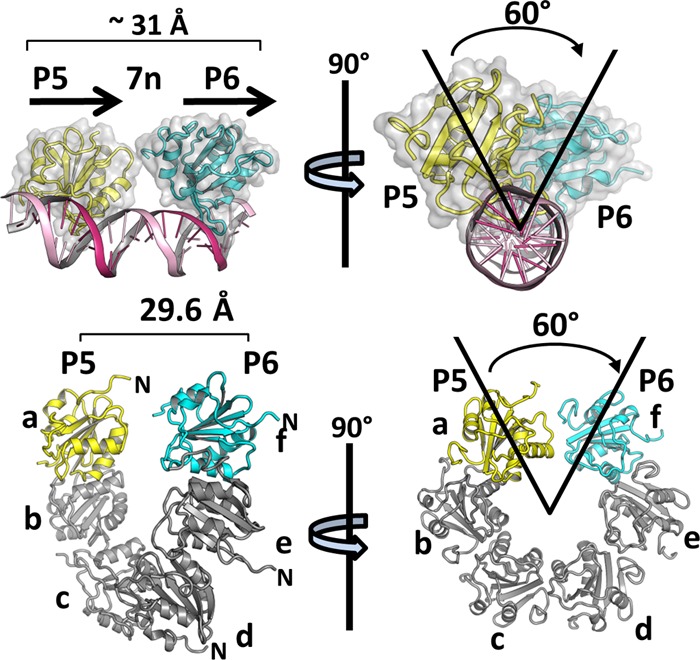
Fig 5.

Spatial correlations between the T-ag OBDs site-specifically bound to pairs of GAGGC pentanucleotides, with OBD pairs within the left-handed spiral. (Top) Two views (rotated by ∼90°) of the OBDs bound to site I are presented as translucent surface representations; the DNA is shown as a ribbon diagram. Values describing the relationships between the OBDs (i.e., the translation and angular rotation) are indicated. (Bottom) Two views of the left-handed spiral structure of the T-ag OBD rotated by ∼90° (the subunits are labeled a to f). Spiral subunit a is yellow, while subunit f is cyan; they are offset by the same angle that separates the OBDs bound to P5 and P6 (i.e., spiral subunits a and f are also 60 degrees apart).
