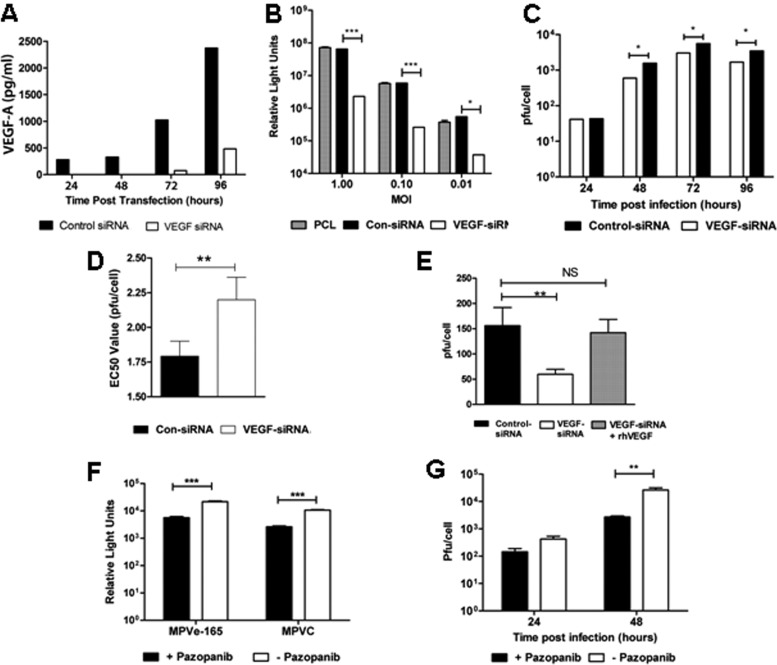
Fig 3.
VEGF-A gene silencing and inhibition of the VEGF-A receptor reduces VV gene expression, replication, and cytotoxicity. (A) SUIT-2 cells were transfected with VEGF-A siRNA or siGENOME RISC-free control siRNA. Cells were seeded in 6-well plates, and VEGF-A ELISA was used to quantify VEGF-A levels in the supernatants over 96 h postseeding. (B) SUIT-2 control or VEGF-A siRNA-transfected cells were infected with VVL15 at an MOI of 1, 0.1, or 0.01 for 24 h, and bioluminescence was quantified using the IVIS imager. (C) SUIT-2 control or VEGF-A siRNA-transfected cells were infected with wild-type VV at an MOI of 1 PFU/cell, and infectious virion production was quantified at 24, 48, 72, and 96 h postinfection (p.i.) using a TCID50 assay. (D) Viral cytotoxicity was measured using an MTS assay (Promega) 3 days p.i. of SUIT-2 control or VEGF-A siRNA-transfected cells infected with serial dilutions of wild-type VV. EC50 values were calculated and the mean EC50 values compared. (E) rhVEGF protein rescues the VV replication in VEGF-specific siRNA-transfected SUIT-2 cells. SUIT-2 cells transfected with VEGF siRNA or control siRNA were exposed to rhVEGF (10 nM) or vehicle buffer for 10 min before infection with VV (MOI = 1 PFU/cell). Infectious virion production was quantified 48 h postinfection using a TCID50 assay. Experiments were performed in triplicate. (F) MPVe-165 or MPVC cells were treated with the VEGFR inhibitor pazopanib for 30 min prior to infection with VVL15 at an MOI of 1 PFU/cell for 24 h, and bioluminescence was quantified using the IVIS imager. (G) MPVe-165 cells were treated with the VEGFR inhibitor pazopanib for 30 min prior to infection with wild-type VV at an MOI of 1 PFU/cell, and infectious virion production was quantified at 24 and 48 h postinfection (p.i.) using a TCID50 assay. Experiments were performed in triplicate, and results represent the data from two separate experiments. The statistical analysis was conducted using two-way ANOVA (C and G) and an unpaired two-tailed Student t test (B, D, E, and F). *, P < 0.05; **, P < 0.01; ***, P < 0.001.

