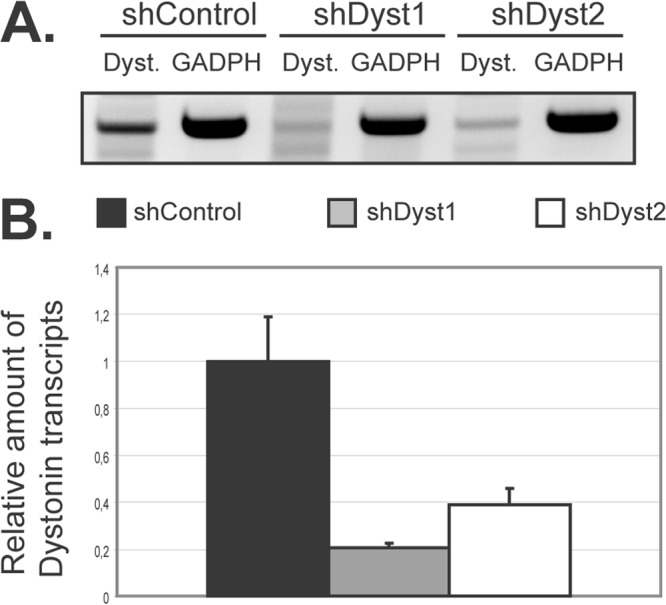
Fig 2.

Silencing of dystonin in HFFF2 cells as assessed by quantitative reverse transcription-PCR (qRT-PCR). (A) Dystonin mRNA levels in silenced cells. HFFF2 cells transduced by two different shRNAs targeting dystonin (shDyst1 and shDyst2) or by an irrelevant shRNA (shControl) were lysed 3 days postransduction. RT-PCR was performed on the extracted total mRNA, and the resulting cDNA was used as a template for a PCR using primers specific for the plakin domain of dystonin (Dyst.) or for GAPDH as a loading control. The PCR product was visualized on an agarose gel (A) or quantified by real-time qPCR where shControl transcript levels were defined as 1 (B). GAPDH transcripts were used as a standard for quantification.
