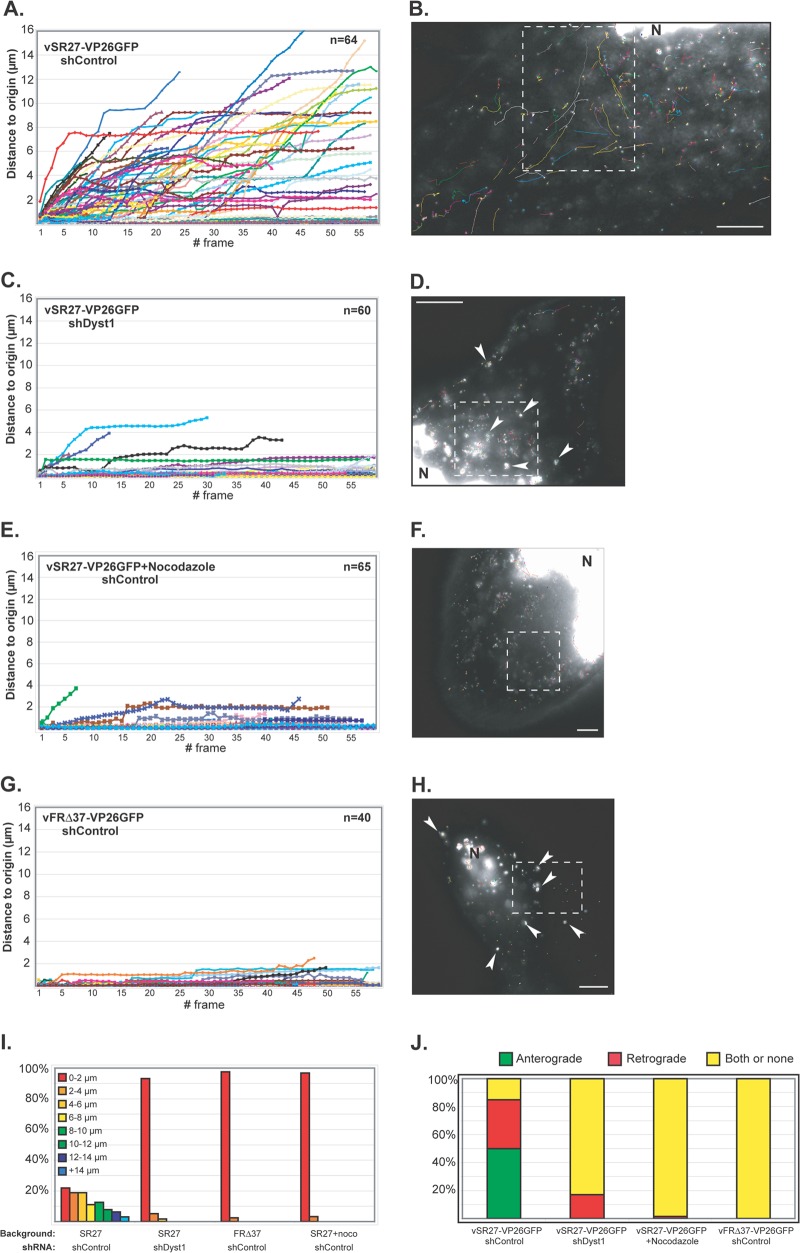
Fig 6.
Impact of dystonin reduction on capsid transport during egress. HFFF2 cells transduced with shControl (A and B and E to H) or shDyst1 (C and D) were infected with one PFU/cell of vSR27-VP26GFP (A to F) or vFRΔ37-VP26GFP (G and H). Cytoplasmic capsid movements were monitored by live-cell imaging at 24 h postinfection, at a rate of one frame per second. Results are plotted as the distance to origin (in μm) for every individual capsid for each frame taken (A, C, E, and G). The premature truncation of some lines is due to the capsids moving out of the field of view. The slope of each line indicates capsid speed. A representative cell with all capsid trajectories from one movie per condition is shown (B, D, F, and H). Dashed boxes show the area displayed in the corresponding movie (see Movies S1, S2, S3, and S4, respectively). N, nucleus. Note the absence (B, F) or presence (arrowheads in D, H) of capsid aggregates. (I) Summary of the maximum distances to origin from the data shown in panels A to H as percentages of cells in categories of distance to origin. (J) Every moving capsid was tracked individually, and its directionality was estimated according to positions of the nucleus and the plasma membrane. “Both or none” indicates either a capsid having opposite directionalities within the same run or the absence of clear directionality. Scale bars, 10 μm.

