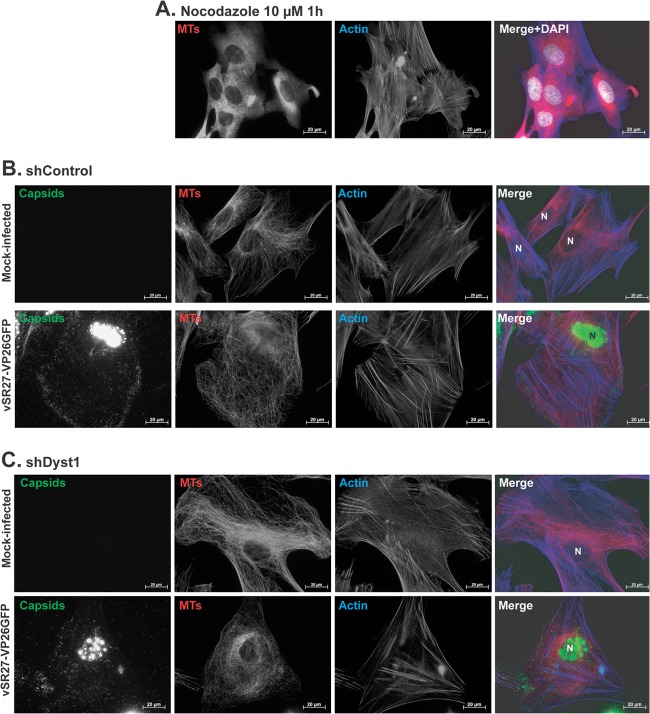
Fig 8.
Effect of nocodazole, infection, and dystonin silencing on MT and actin networks. (A) HFFF2 cells were incubated with 10 μM nocodazole for 1 h before being fixed and stained with MAb DM1A against alpha-tubulin and GAM488 (pseudocolored in red) and with TRITC-conjugated phalloidin to label actin (blue). Nuclei were visualized with DAPI (white). shControl (B) or shDyst1 HFFF2 (C) cells were either mock infected or infected with 5 PFU/cell of vSR27-VP26GFP. Twenty-four hours later, cells were fixed and stained with MAb DM1A against alpha-tubulin and GAM633 (red) and with TRITC-conjugated phalloidin to label actin (blue). Capsids were visible through direct GFP fluorescence (green). N, nucleus. Scale bars, 20 μm.

