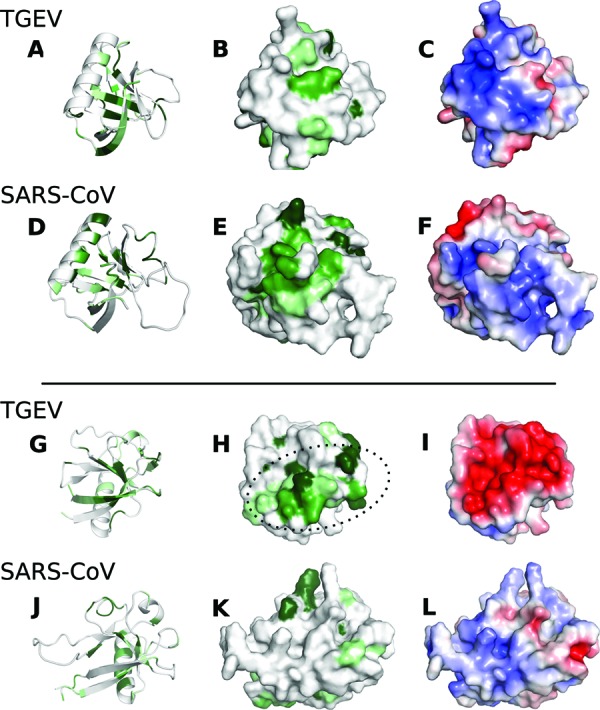
Fig 4.

Superposed structures of TGEV nsp1 and SARS-CoV nsp113–128 are presented separately in two different rotations: rotation 1 (A to F) and rotation 2 (G to L). Conserved residues within each genus are shown in green, where darker green corresponds to a higher level of conservation. In each rotation, TGEV nsp1 and SARS-CoV nsp113–128 are shown as cartoons and surface representation displaying the conserved areas. Subfigures C, F, I, and L show the electrostatic surface potentials of the two structures from −4/+4 mV. The electrostatic potential was calculated using the software programs APBS and PDB2PQR using the PARSE force field (48–50). The area within the dotted oval in subfigure H corresponds to the two conserved areas shown in Fig 3.
