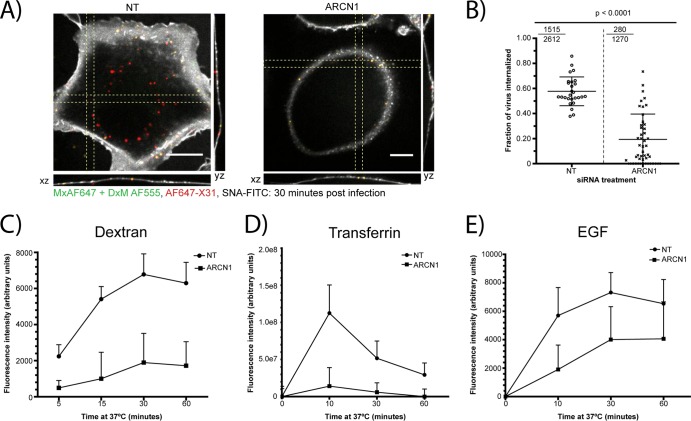
Fig 2.
ARCN1 knockdown cells exhibit defective internalization of influenza virus and other cargoes. (A) Representative confocal xy, yz, and xz cross-sectional images of AF647-X31-infected siRNA-treated cells (red) at 30 min postinfection (mpi). The plasma membrane was labeled using SNA-FITC (white). Nonpermeabilizing immunofluorescence staining with an antibody specific for AF647 (green) was performed to differentiate plasma membrane-proximal particles as being noninternalized (yellow) or internalized (red). Scale bars, 10 μm. (B) Fraction of virus internalized, of the total number of virus particles per cell. The internalized virus fraction was counted for more than 30 cells per siRNA treatment condition, and values are graphed in the form of a dot plot. Statistical analysis was performed using a one-sided Student t test. Furthermore, for each siRNA treatment, a ratio is presented in the top left corner (the numerator denotes the total particles internalized, and the denominator represents the total number of particles counted among all cells). (C to E) Quantification of TMR-dextran (C), AF568-Tfn (D), and AF647-EGF (E) uptake in nontargeting and ARCN1 siRNA-treated cells from at least 18 different confocal z-stacks per time point.

