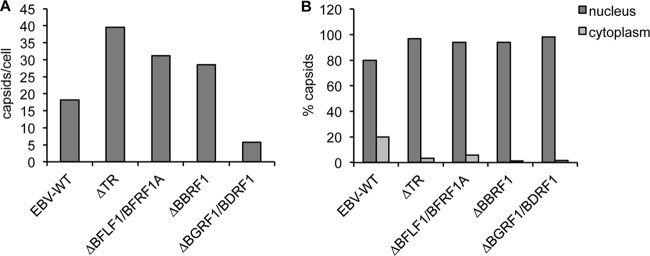
Fig 3.

Results of the electron microscopic analysis of producer cells. (A) Absolute numbers of EBV capsids per replicating producer cells. A total of 350 cells per mutant were analyzed. (B) The percentages of capsids observed in the nucleus or cytoplasm of the different producer cell lines studied are indicated.
