
Fig 5.
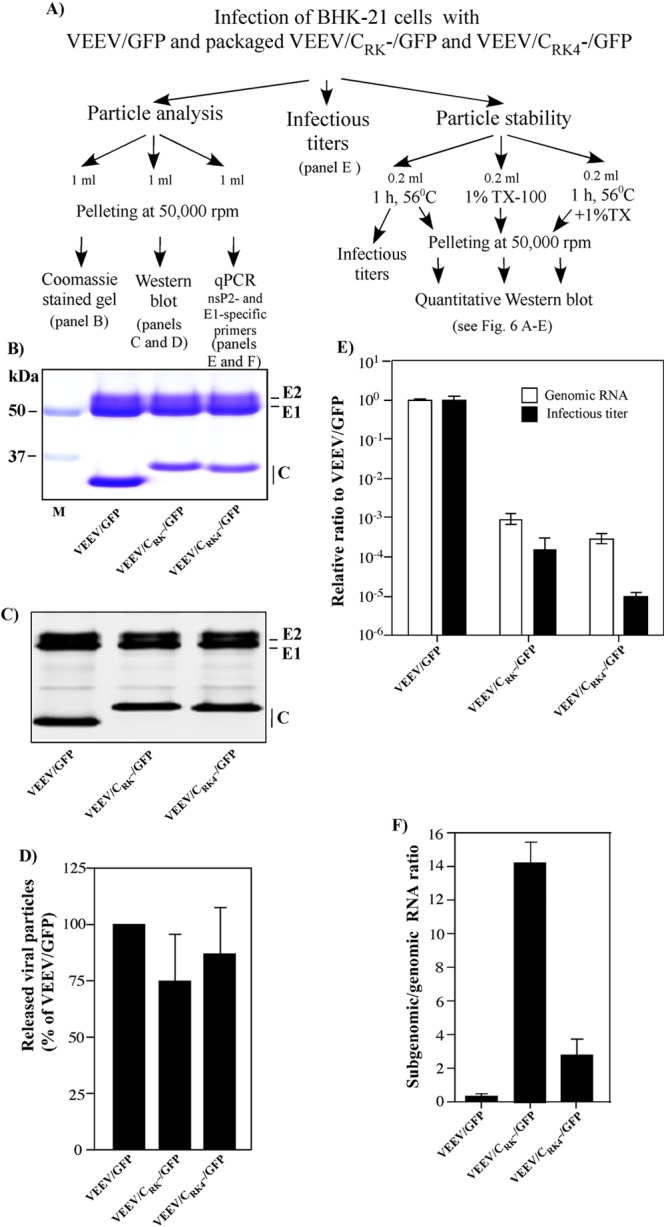
Results of comparative analysis of VEEV virions and VLPs formed by replicating PIV genomes. (A) Schematic diagram of the experiments conducted for particle analysis. The data were collected in three independent experiments. In each experiment, the released viral particles were analyzed for their infectivity, stability, and RNA and protein content (see Materials and Methods for details). (B) Representative Coomassie blue-stained gel with particles pelleted from 1 ml of medium harvested from cells infected with VEEV/GFP- or PIV genome-containing particles. (C) Representative Western blot of released viral particles. (D) Results of quantitative analysis of the membrane presented in panel C. (E) Comparative analysis of infectious titers of released viral particles and levels of packaged viral and PIV genomic RNAs (see Materials and Methods for details). Infectious titers and concentrations of the genomic RNAs were normalized to those of VEEV/GFP. (F) Subgenomic/genomic RNA ratios in released viral particles were determined by RT-qPCR. Panels B and C are representative images from one of three highly reproducible experiments. The quantitative data from three independent experiments were used for calculation of means and standard deviations for panels D, E, and F.