Fig 2.
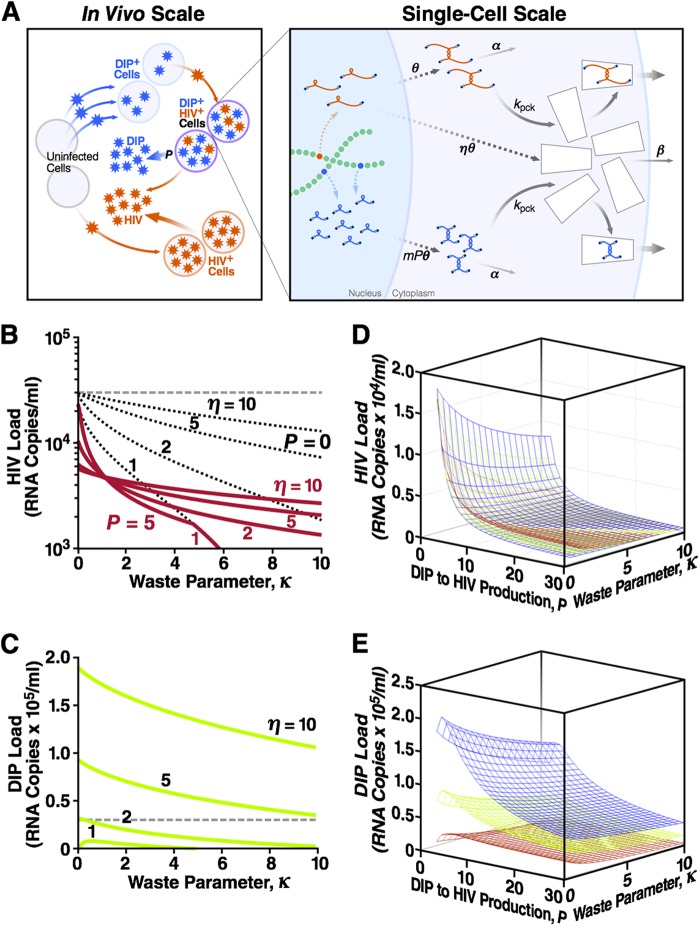
DIPs that steal capsid proteins stably suppress the HIV-1 load across a broad range of parameters. (A) The model comprises two scales of biological organization. The in vivo (individual host) scale is the standard model of HIV-1 replication, expanded to include DIPs (see Supplemental Methods, equations S28 to S33, in the supplemental material). Uninfected cells can be infected with either HIV-1 or DIP, and DIP+ cells can be superinfected with HIV-1 to become dually infected cells. The single-cell model is described by equations 1 to 3. A dually infected cell has one integrated HIV-1 provirus and multiple, m, copies of DIP provirus. A fraction of HIV-1 gRNA is translated into proteins that form “empty” capsids. The DIP does not express proteins. Dashed arrows represent multistage processes (including the loss of RNA monomers and capsid proteins). A fraction of stable dimer genomes and full capsids is also lost. Remaining genomes, HIV-1 or the DIP, are packaged within capsids and released as infectious particles. Shown also are the steady-state HIV-1 load (B) and the steady-state DIP load (C) at different values of two single-cell parameters: the capsid waste parameter, κ, and the capsid-to-genome production ratio, η (Table 1). The dashed line indicates the HIV-1 viral load in the absence of capsid waste and the DIP (κ = P = 0), which is assumed to be the average load in untreated humans (3 × 10⁴ RNA copies/ml blood). Calculations use a DIP/HIV-1 production ratio (i.e., expression asymmetry) of P = 5 and a basic reproduction ratio of R0 = 10 (Table 1). The decrease in HIV-1 load in the presence of capsid waste (κ > 0, red lines), compared to the untreated HIV-1 “set-point” level (dashed line), is partly due to the loss of HIV-1 products (black dotted lines calculated at P = 0) and partly due to the DIP, which competes with HIV-1 for available target cells and steals HIV-1 capsid in dually infected cells. The first effect is more important at η = ∼1, and the DIP suppression factor is stronger at a large η value (see Fig. S2 in the supplemental material). Shown also are the steady-state HIV-1 load (D) and the steady-state DIP load (E) as functions of both expression asymmetry, P, and capsid waste parameter, κ, at three values of the capsid-to-genome ratio: η = 2 (red), η = 5 (green), and η = 10 (blue). These 3D plots act as a partial sensitivity analysis showing that HIV-1 and DIP loads depend strongly on the value of P.

