
Fig. 3. ATP hydrolysis catalyzed by HCV helicase (Hel-1a) and site-directed mutants.
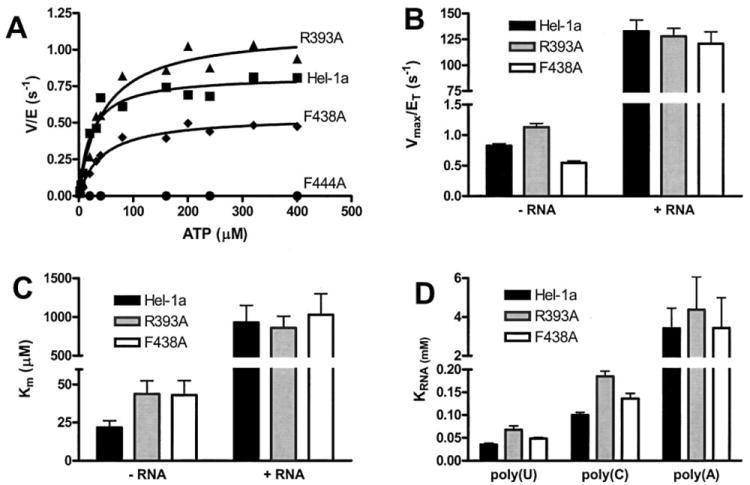
A, initial rates of ATP hydrolysis (v, nmol/s) divided by the amount of total enzyme in the reaction (E, nmol) plotted versus ATP concentration for wild type (squares), R393A (triangles), F438A (diamonds), and F444A (circles). Data are fit to the Michaelis-Menten equation to yield kinetic constants plotted in B and C. B, Vmax (nmol/s) divided by total enzyme (nmol), which is equivalent to the turnover rate constant kcat, for Hel-1a (black), R393A (gray), and F438A (white). Data were obtained from 12 reactions (performed in triplicate) at ATP concentrations ranging from 2 μm to 4 mm. Reactions were repeated in the presence and absence of 2 mg/ml poly(U) RNA. C, Km values for ATP hydrolysis obtained from the same reactions described in B. D, concentration of poly(U), poly(C), or poly(A) RNA necessary to support a half maximum rate of ATP hydrolysis (KRNA) catalyzed by Hel-1a (black), R393A (gray), or F438A (white). KRNA values were obtained by fitting rates obtained in the presence of 9 different RNA concentrations to the equation; v = Vmax [RNA]/KRNA+[RNA]. Error bars in B, C, and D show the S.E. in non-linear regression analyses.