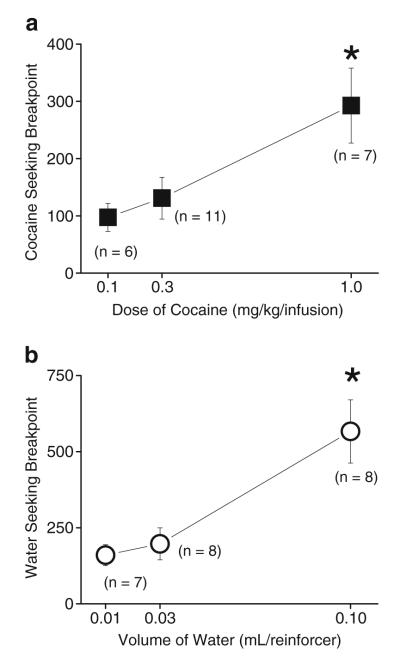
Fig. 1.
These plots indicate BtwPR-seeking BPs for cocaine and water reinforcers as a function of dose of cocaine or amount of water a The top panel shows BtwPR-seeking BPs as a function of the dose of cocaine available during the consumption phase (0.1, 0.3, and 1.0 mg/kg/inf cocaine). b The bottom panel shows BtwPR-seeking BPs as a function of the water amount available during the consumption phase (0.01, 0.03, and 0.1 mL/reinforcer). Note that the Y-axis values are different for the cocaine and water plots. *p<0.05 indicate a significant difference between reinforcer magnitude. See text for detailed description

