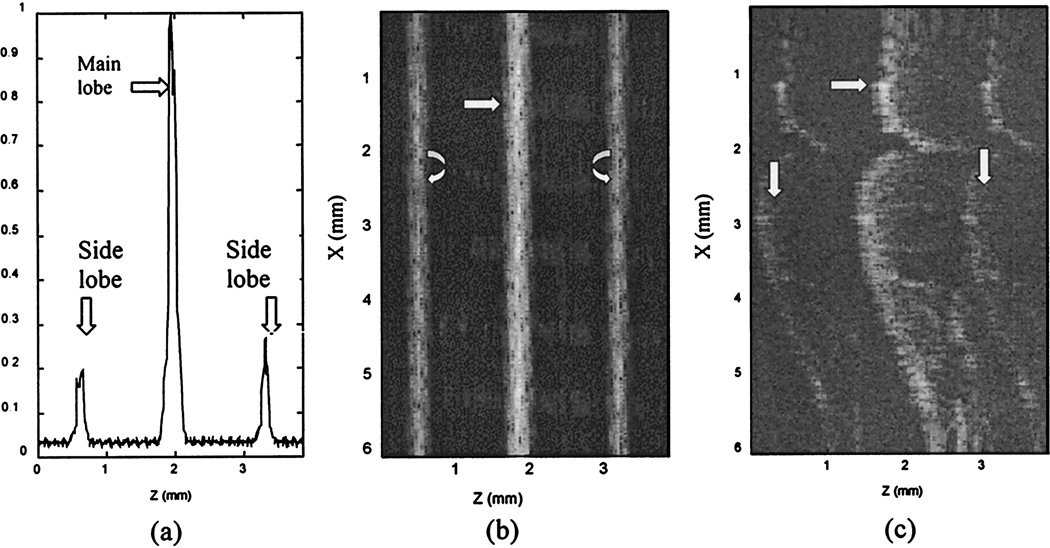
Fig. 4.
PSF of the system and the resultant image artifacts. (a) Normalized PSF of the system or A-scan line measured from a planar mirror. The horizantal axis is the propagation depth, and the distance between the main lobe and a sidelobe is 1.335 mm. (b) Image of a mirror. The propragation direction is left to right. The vertical axis is the spatial scan dimension. The central line is the mirror, and the two lines at the sides of the central line are sidelobe artifacts. (c) Image of an extracted tooth. The central curve is the air–enamel interface. The sidelobe artifacts are clearly shown by two complicated curves, pointed to by the two vertical arrows, on the sides of the central curve.

