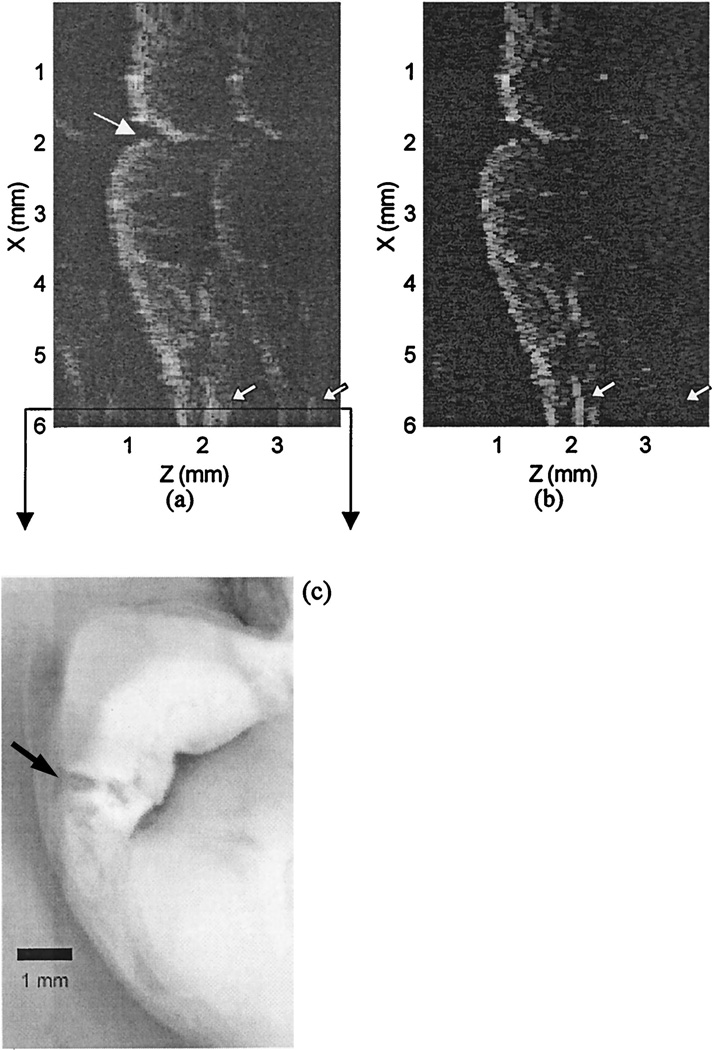
Fig. 5.
(a) Original tooth image. (b) CLEANed image. (c) Microscopic picture of the sectioned tooth image. The OCT image dimensions are 6 mm (vertical, X) by 3.84 mm (horizontal, Z); the pixel size is 15m × 15 m. The sidelobe artifact curves are reduced to the background level. The air–enamel interface is enhanced after application of CLEAN, and the sidelobe energy of the enamel–dentin inference, pointed to by the small arrow at the bottom right in (a) and (b) is removed after CLEAN has been applied.

