Abstract
We are developing a methodology for the noninvasive imaging of glucose transport in vivo with PET and 18F-labeled 6-fluoro-6-deoxy-d-glucose (18F-6FDG), a tracer that is transported but not phosphorylated. To validate the method, we evaluated the biodistribution of 18F-6FDG to test whether it is consistent with the known properties of glucose transport, particularly with regard to insulin stimulation of glucose transport.
Methods
Under glucose clamp conditions, rats were imaged at the baseline and under conditions of hyperinsulinemia.
Results
The images showed that the radioactivity concentration in skeletal muscle was higher in the presence of insulin than at the baseline. We also found evidence that the metabolism of 18F-6FDG was negligible in several tissues.
Conclusion
18F-6FDG is a valid tracer that can be used in in vivo transport studies. PET studies performed under glucose clamp conditions demonstrated that the uptake of nonphosphorylated glucose transport tracer 18F-6FDG is sensitive to insulin stimulation.
Keywords: glucose transport, radiopharmaceutical, PET, glucose clamp
Alterations in glucose transport have been associated with multiple pathologic disorders, including diabetes, cancer, obesity, and neurologic and psychiatric disorders. Over the past 2 decades, the prevalence of type 2 diabetes in the United States has increased 49%, and the incidence has doubled (1–3). The incidence of obesity, which is significantly associated with diabetes (3), has also increased. An important physiologic manifestation of insulin-resistant states and diabetes is a reduction in insulin-stimulated glucose transport (4,5). Accordingly, a method that enables the measurement of glucose transport in vivo under normal and pathologic conditions will advance the understanding of the pathogenesis of insulin resistance as well as mechanisms underlying the pathophysiology of diabetes. For this purpose, we have developed 18F-labeled 6-fluoro-6-deoxy-d-glucose (18F-6FDG) as a PET tracer for the noninvasive imaging of glucose transport in vivo.
Because glucose is an uncharged polar molecule that does not readily pass through cell membranes, glucose transporters (GLUTs) are necessary to facilitate the glucose transport processes. Therefore, a valid glucose transport tracer must interact with GLUTs in a manner similar to that of glucose. 18F-labeled 2-fluoro-2-deoxy-d-glucose (18F-2FDG), the most common PET radiopharmaceutical, is transported by the facilitative GLUTs. Once inside the cell, 18F-2FDG is phosphorylated and thus trapped. This phosphorylation makes it difficult to quantify the transport step alone. Moreover, 18F-2FDG is a somewhat poor substrate for the sodium-dependent glucose cotransporters (SGLTs) expressed in the kidneys; the lack of reabsorption of the tracer by the kidneys results in the high activity commonly seen in the bladder in clinical PET scans (6).
To date, there has been a lack of 18F-labeled tracers that are transported as glucose but not metabolized. Perhaps the best known candidate is 18F-labeled 3-fluoro-3-deoxy-d-glucose (18F-3FDG). Halama et al. (7) evaluated the myocardial uptake of 18F-3FDG in an isolated heart preparation and found evidence that it was metabolized by hexokinase. Others observed multiple metabolic products in the brain and concluded that 18F-3FDG might be an indicator of aldose reductase activity (8,9). Moreover, Berkowitz et al. (9) reported metabolic products of 18F-3FDG appearing in the urine. In contrast, we observed negligible urinary excretion of activity after 18F-6FDG injection into rats (10). Thus, the presence of multiple metabolic products of 18F-3FDG makes it unsuitable as a tracer for the measurement of the glucose transport step.
3-O-methyl-d-glucose (3OMG), the reference compound for glucose transport, is transported but not phosphorylated, and some investigators have used 11C-labeled 3OMG (11C-3OMG) for PET (11–17). However, the 20-min half-life of 11C limits the use of 11C-3OMG only to facilities with cyclotrons. In addition, its preparation generally requires a separate cyclotron irradiation and synthesis for each experiment, and the relatively short half-life limits the duration over which its biodistribution can be observed. These factors are significant impediments to its clinical use.
As detailed in our previous reports (10,18), there has been no success with iodinated and other putative glucose transport tracers that have the potential to be imaged with PET or SPECT. In particular, many of the iodinated glucose derivatives are metabolized, their transport is not responsive to insulin stimulation, or they can only be transported by specific GLUTs. Accordingly, we have pursued the use of 18F-6FDG as a marker of glucose transport (10,18). The facts that 18F-6FDG lacks a hydroxyl on carbon-6 and cannot be phosphorylated address the limitation of 18F-2FDG in tracing transport alone, and the 110-min half-life of the 18F label helps overcome the disadvantages associated with the short half-life of 11C-3OMG. In addition, in earlier studies with clone 9 cells that express GLUT1 and 3T3-L1 adipocytes that express GLUT1 and GLUT4, we showed that 3H-labeled 6FDG is transported in a manner similar to that of 3H-labeled 3OMG in response to the inhibition of oxidative phosphorylation or insulin (10); in addition, it is well transported by SGLTs in the proximal tubules of the kidneys (10). Moreover, many years ago, 3H-6FDG was shown to be transported and concentrated across intestinal sacs (19). Here we further establish the potential use of 18F-6FDG as a marker of glucose transport. The results will help in the development of this tracer and a model for quantifying the rate of glucose transport distinctly from the other steps of glucose metabolism.
MATERIALS AND METHODS
18F-6FDG Production
18F-6FDG was synthesized through a modification of a previously reported procedure (18). In brief, 3,5-O-benzylidene-6-deoxy-1,2-O-isopropylidene-6-(4'-methylbenzene)sulfonyloxy-α-d-glucofuranose was prepared as a precursor for radiolabeling through nucleophilic fluorination with 18F-potassium fluoride. The resulting protected 18F-6FDG was hydrolyzed with hydrochloric acid. The resulting solution was neutralized with sodium hydroxide and purified with C-18 Sep-Pak (Waters Corporation) to yield 18F-6FDG. The product was analyzed by radio-thin-layer chromatography (acetonitrile:-water, 8:2, v/v) and verified by cospotting with a 6FDG cold standard. The radiochemical purity was greater than 99%.
18F-6FDG PET
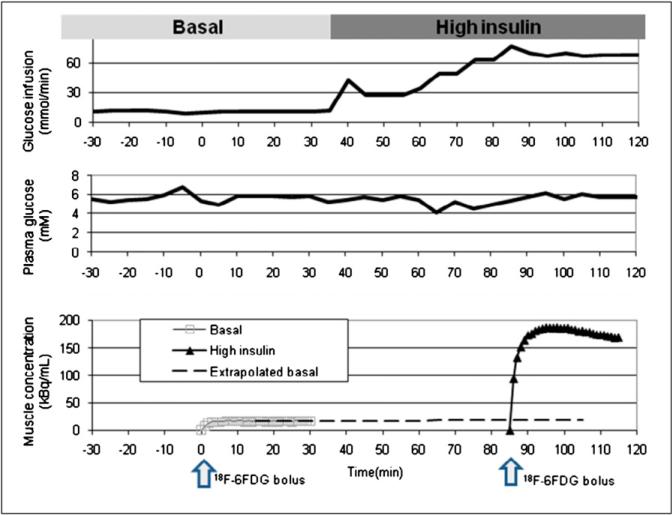
PET was performed in a single session for the basal and insulin-stimulated conditions according to the time course illustrated in Figure 1. For both conditions, the glucose infusion rate (Fig. 1, top) was adjusted to maintain a 6 mM plasma glucose concentration (Fig. 1, middle). During the experiment, anesthetized rats were positioned with their hind legs centered in the field of view of an R4 microPET small-animal PET scanner (Siemens) (20). Blood samples (~5 μL each) were collected every 5 min and used to measure plasma glucose (Advance Microdraw; Hypoguard USA, Inc.). The first 30 min after the induction of anesthesia were considered a stabilization period, and we made no attempt to adjust the plasma glucose concentration unless it was less than 3 mM, in which case we administered 25% (w/v) d-glucose (dextrose). Beyond the stabilization period, the glucose infusion rate (GIR) was adjusted to achieve and maintain a 6 mM plasma glucose concentration. When the glucose concentration had stabilized for at least 15 min, a 7-min transmission scan was acquired with a 57Co source. Next, 18F-6FDG was injected as a bolus in the jugular vein catheter and, at the same time, a 30-min PET acquisition and blood sampling from the arterial catheter were initiated. Over the first 2 min, blood was withdrawn at a rate of 0.2 mL/min past a flowthrough radiation detector (21). For the remaining 28 min, 6 blood samples (20 μL each) were manually withdrawn with a syringe at 2.5, 5, 10, 15, 20, and 30 min.
FIGURE 1.
(Top) Glucose infusion rate over duration of typical experiment. Insulin infusion was begun at 35 min, and glucose infusion rate was increased to maintain plasma glucose concentration at approximately 6 mM. (Middle) Observed glucose concentrations. Data showed that glucose concentrations were similar under basal and insulin-stimulated conditions. (Bottom) Times of injection of 18F-6FDG (arrows) and resultant time courses of activity in gastrocnemius muscle (solid curves) under basal and insulin-stimulated conditions. Contribution of activity from that remaining from first scan was removed from second scan by extrapolation (dashed curve) and subtraction.
After the PET scan at the baseline, a PET scan was acquired under conditions of insulin stimulation (insulin-stimulated conditions). A solution with either a low or a high concentration of insulin was used; the former contained insulin at 160 mU/mL (Humulin; Eli Lilly), and the latter contained insulin at 1,000 mU/mL. For both, the insulin was mixed with 0.3 mL of plasma obtained from a donor rat and a volume of normal saline to achieve a total solution volume of 10 mL. The solution was infused at a rate of 10 μL/min, typically beginning at about 90 min, and the glucose infusion rate was increased as necessary to maintain the target 6 mM plasma glucose concentration. After a period of stabilization with a glucose concentration of 6 mM for at least 15 min, a PET scan was acquired under insulin-stimulated conditions along with blood sampling in a manner analogous to that used for the basal conditions, except that the injected activity of 18F-6FDG was approximately 5-fold higher.
CT
CT was performed with 2 rats to provide an anatomic reference to aid in the interpretation of PET images. These images were acquired with the CT component of an XSPECT (GammaMedica-Ideas) system. Immediately before PET, anesthetized rats were scanned by CT for 90 s with 256 projections over 360°, 45 kV, and 0.75 mA. Data were reconstructed into a 512 × 512 × 512 matrix with voxels of 0.155 × 0.155 × 0.155 mm.
Blood Sample Processing
Blood samples were centrifuged and separated; plasma and red blood cell activities were measured with a well counter (Compu-γ-1282; LKB-Wallac). The plasma insulin concentration in selected samples was measured by use of an Ultra Sensitive Rat Insulin ELISA Kit (Crystal Chem, Inc.).
Animal Model
Adult male Sprague–Dawley rats (mean ± SD weight, 262 ± 7 g) were purchased from Harlan Sprague–Dawley, Inc., and housed in the Animal Research Center at Case Western Reserve University. The rats had free access to food and water. Lighting was on from 08:00 to 20:00 and off from 20:00 to 08:00. After a 6-d quarantine period, carotid artery and jugular vein catheters were implanted by the Mouse Metabolic Phenotyping Center at Case Western Reserve University. Rats were anesthetized, and Micro-Renathane (MRE-033; outer diameter, ~0.084 cm [0.033 in.]; inner diameter, ~0.036 cm [0.014 in.]; Brain Braintree Scientific) tubing catheters were placed in the carotid artery and jugular vein with an aseptic technique. Analgesia after surgery was provided by 0.2 mL of a 0.025% solution of bupivacaine. Ampicillin (0.2 mL/d, administered in a solution containing 117 mg of ampicillin and 2,000 U of heparin in 10 mL of normal saline) was administered as a prophylactic agent against infection. The carotid catheter was maintained by daily flushes of 0.5 mL of heparinized saline (10 U/mL). The jugular vein catheter was flushed with the antibiotic solution for the first 4 d. Thereafter, it was flushed with 0.5 mL of heparinized saline (10 U/mL). Rats were used for PET only after they were deemed to have recovered from surgery, as evidenced by body weight matching or exceeding their presurgical weight, typically 3–4 d. In preparation for scanning, rats were fasted for 14 h to significantly deplete glycogen stores in muscle, and anesthesia was provided by 2% isoflurane in oxygen. These procedures were performed in compliance with recommendations of the Institutional Animal Care and Use Committee of Case Western Reserve University.
Metabolites
The number of potential metabolic pathways precludes our ability to characterize them all, so we focused on phosphorylation as the key pathway. To evaluate whether 18F-6FDG could be phosphorylated, we incubated 5.5 μmol of 14C-6FDG (ul) in a 1-mL reaction mixture containing 100 mM triethanolamine buffer (pH 7.8), 1.1 mM adenosine triphosphate, 3 mM MgCl2, and 5 U of hexokinase (mixture of isoenzymes) for 1 h at 30°C. As a control, we incubated 5.5 μmol of 14C-glucose (ul) under the same conditions. Reaction mixtures were passed through anion exchange columns in the formate form with deionized water as the solvent. The fractions eluted with water were counted by liquid scintillation and identified as free sugar. Activity that was retained on columns was eluted with 4 M formic acid, counted by liquid scintillation, and interpreted as being radioactive metabolites of 14C-6FDG.
Data Analysis
PET data were reconstructed with software provided by the scanner manufacturer. Specifically, we used Fourier rebinning and 2-dimensional filtered backprojection to produce dynamic image sequences of 128 × 128 × 63 voxels with a spacing of 0.85 × 0.85 × 1.2 mm. Pixel values were corrected for radioactive decay and scatter and calibrated to the radioactivity concentration.
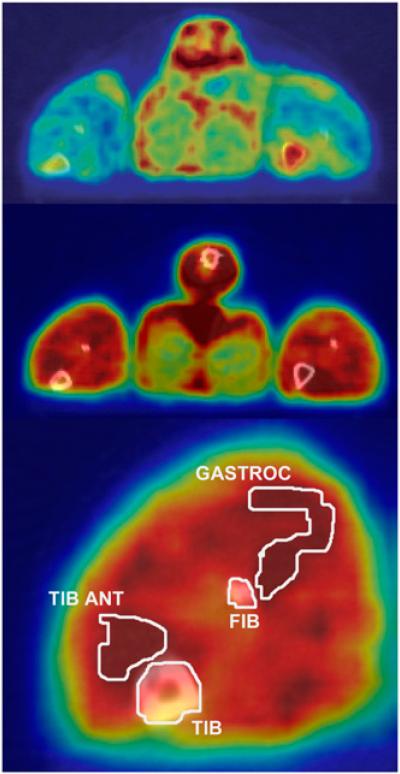
Using COMKAT software (http://comkat.case.edu) (22), we aligned the image volumes with CT image volumes to provide anatomic references for image interpretation, as illustrated in Figure 2. Volumes of interest (VOIs) were first drawn over the tail, femur, tibia, and fibula of the basal PET scan. Skeletal muscle VOIs were drawn on the gastrocnemius muscle on images acquired during the study with a high insulin concentration, wherein they were best visually identified. All VOIs were applied to 18F-6FDG PET scans acquired under both basal and insulin-stimulated conditions, as the rat's position was maintained during the entire time interval. Tissue time–activity curves were obtained by applying VOIs to images acquired under basal and insulin-stimulated conditions.
FIGURE 2.
CT images (gray scale) fused with PET images (color scale) of same rat in basal state (top) and high-insulin state (middle and bottom), illustrating data analysis procedure and typical imaging results. Contours illustrate boundaries of VOIs. Rat was lying prone with its hind legs extended caudally. These images reflected tissue activity between 0 and 30 min after 18F-6FDG injection. FIB = fibula; GASTROC = gastrocnemius; TIB = tibia; TIB ANT = tibialis anterior.
Tissue activity attributed to 18F-6FDG in the first scan (basal state) was normalized by the mass of the rat and injected activity. Tissue activity measured during the scan acquired under insulin-stimulated conditions was corrected for activity remaining from the first scan by extrapolation and subtraction, as illustrated in Figure 1 (bottom). Error in the correction was minimal (less than 10%) because of radioactivity decay and because the activity in the second injection was much higher than that in the first injection. The resultant activity curve for injection 2 (insulin stimulation) was normalized for rat mass and injected activity.
Fluid Balance
Approximately forty 5-μL samples were collected for the determination of glucose concentrations, for a total blood volume of approximately 200 μL. The 0.4 mL of blood withdrawn over the first 2 min after each 18F-6FDG injection for input function determination was returned to the rat through venous infusion. Between 2 and 30 min after each injection, a total of twelve 50-μL samples were collected, for a total volume of 600 μL. Therefore, a total of 800 μL of blood, or about 5% of the rat's blood volume, was removed. The total amounts of fluid infused were 900 μL in the insulin solution and 600–6,300 μL in the glucose solution over the course of the approximately 3-h experiment.
Statistical Tests
Unless otherwise stated, a 2-tailed, paired t test was used to assess the intraanimal differences of various parameters between basal and insulin-stimulated conditions. P values of less than 0.01 were deemed to indicate statistically significant differences.
RESULTS
Clamp
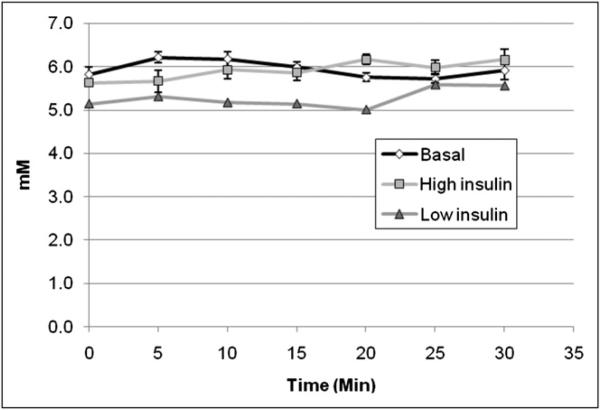
Table 1 summarizes the metabolic parameters evaluated during the PET scans under the glucose clamp conditions. During the infusion of insulin at 10 mU/min (high-insulin state), performed in 7 rats, the plasma glucose concentration was 5.9 ± 0.5 mM (mean ± SD)—the same as that in the basal state. Low rates of glucose infusion were sufficient to maintain the basal glucose concentration. The glucose concentration measured throughout the PET scans acquired in 2 additional rats during an infusion of insulin at 1.6 mU/min (low-insulin state) was 5.3 ± 0.3 mM. The plasma glucose concentration was 5.9 ± 0.4 mM after the basal values from all 9 rats were pooled. The time course of the 7 points observed during the 30-min PET scans is shown in Figure 3.
TABLE 1.
Metabolic Parameters Evaluated in Glucose Clamp Study
| Value in following state: |
|||
|---|---|---|---|
| Parameter | Basal | Low insulin | High insulin |
| No. of rats | 9 | 2 | 7 |
| Arterial glucose concentration (mM)* | 5.9 ± 0.4 | 5.3 ± 0.3 | 5.9 ± 0.5 |
| Arterial insulin concentration (pmol/mL)* | 0.5 ± 0.4 | Not available | 12.2 ± 1.1 |
| GIR (μmol/min)* | 9.0 ± 3.8 | 30.6 ± 2.8 | 71.7 ± 10.3 |
Reported as mean ± SD.
FIGURE 3.
Plasma glucose concentrations measured in arterial blood samples collected every 5 min. With perfect glucose clamp, concentrations should be same in all states. Concentration of 5.3 ± 0.3 mM measured during low-insulin state was slightly lower than concentration of 6.2 ± 0.4 mM measured during basal state in these animals, although this small difference was statistically significant. Concentrations in high-insulin state and basal state were both 5.9 ± 0.5 mM. Error bars denote SE for basal state (n = 9) and high-insulin state (n = 7) and were omitted for low-insulin state (n = 2).
Insulin concentrations measured in arterial plasma samples collected in the experiments with high-insulin and basal states were 12.2 ± 1.1 and 0.51 ± 0.40 pmol/mL, respectively; this difference was significant. Insulin concentrations were not measured in the experiments with low-insulin and basal states.
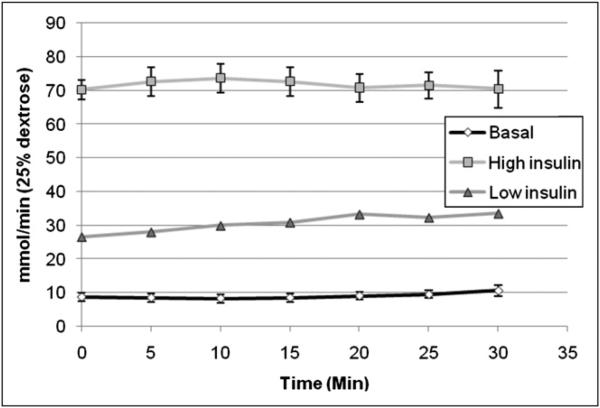
As shown in Figure 4, the GIR during insulin stimulation had to be increased over the baseline to maintain the ~6 mM plasma glucose concentration. Specifically, the GIRs were 71.7 ± 10.3 μmol/min during insulin stimulation and 9.7 ± 3.9 μmol/min at the baseline in rats subjected to the high-insulin protocol (n = 7) and 30.6 ± 2.8 and 6.7 ± 2.4 μmol/min, respectively, in the low-insulin protocol (n = 2). The increases over the baseline were statistically significant, at 7.4- and 4.6-fold in the high- and low-insulin protocols, respectively.
FIGURE 4.
Average GIR needed to maintain 6 mM plasma glucose concentration. This value was higher during low-insulin (n = 2) and high-insulin (n = 7) infusions than at baseline (n = 9). Error bars denote SE.
PET Image Data
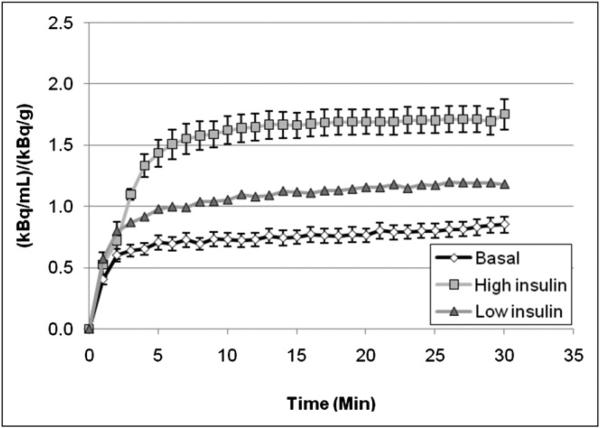
The injected 18F-6FDG doses were 8.41 ± 0.28, 35.8 ± 3.83, and 34.9 ± 1.10 MBq for the basal, low-insulin, and high-insulin states, respectively. The time courses of radioactivity in skeletal muscle during the 9 scans for the basal protocol, the 2 scans for the low-insulin protocol, and the 7 scans for the high-insulin protocol are shown in Figure 5. These were obtained with the regions of interest exemplified in Figure 2. Such PET images were fused with CT images for the basal and high-insulin states from the same rat. The brighter appearance of the gastrocnemius muscle in the experiments with high-insulin and basal states indicates that insulin stimulation increased the concentration of 18F activity in this skeletal muscle. During the scan acquired under basal conditions, the activity concentrations (percentage injected dose per milliliter of tissue) at 30 min were 0.8 ± 0.1 under low-insulin conditions and 1.7 ± 0.1 under high-insulin conditions. The fold increases over the baseline were 1.7 for low-insulin conditions and 2.0 for high-insulin conditions, demonstrating a stepwise increase in the uptake of 18F-6FDG activity with increasing insulin dose.
FIGURE 5.
Tissue time–activity curves for gastrocnemius muscle during scans acquired under high-insulin conditions (n = 7), low-insulin conditions (n = 2), and basal conditions (n = 9), demonstrating increased 18F-6FDG uptake caused by insulin administration. Error bars are not shown for low insulin because of small number of subjects, although maximum difference between individual curves from 2 rats was 25%.
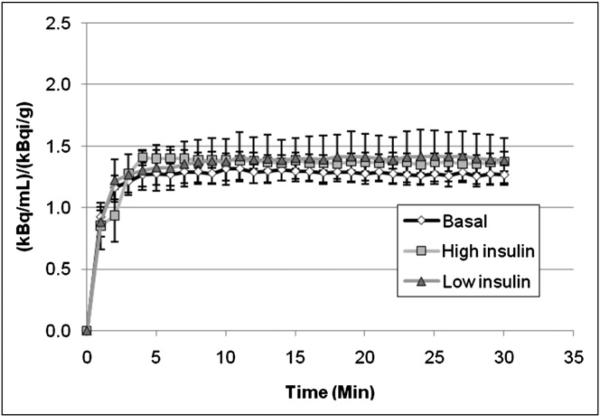
Figure 6 shows that the radioactivity concentration in bone marrow did not exhibit the effect of insulin stimulation that was evident in skeletal muscle. Note that activity concentrations were normalized for percentage injected dose per gram of rat. In addition, the contribution of activity observed during the basal scan to that observed during the scan acquired under insulin-stimulated conditions was removed by extrapolation and subtraction, as illustrated in Figure 1 (bottom).
FIGURE 6.
Bone marrow time–activity curves in basal, low-insulin, and high-insulin states. These curves were comparable, indicating lack of effect of insulin stimulation on glucose transport in marrow. This result was in contrast to effect observed in skeletal muscle in Figure 5.
Metabolites
After 14C-6FDG (ul) and hexokinase were incubated, the reaction mixture was passed through an anion exchange column. All of the activity loaded in the column was present in the eluate, indicating a lack of evidence of phosphorylation. In contrast, and as expected, none of the activity from the 14C-glucose (ul) control flowed through the column, indicating the phosphorylation of all of the 14C-glucose (ul).
DISCUSSION
The primary result of this report is that the skeletal muscle concentration of radioactivity after 18F-6FDG injection is increased by insulin stimulation (Fig. 5). Although isoflurane anesthesia may impact glucose transport, our study design controlled for this effect with the use of the same anesthesia for both basal and insulin infusion conditions. The necessity to increase the GIR to maintain the plasma glucose concentration during insulin infusion, the well-known physiologic effect of insulin on glucose transport in skeletal muscle, and our earlier transport studies in cells strongly support the hypothesis that 18F-6FDG can be used as a valid tracer of glucose transport.
We attribute the observed tissue activity to 18F-6FDG, assuming that there is little metabolism of 6FDG over the time scale of our experiments. Preliminary data support a lack of metabolites. For example, little activity, less than 1%, was found in the urine after 18F-FDG injection unless phlorizin, a selective blocker of SGLTs, was administered (10). Also, there was no visual evidence of focal radioactivity accumulation in bone (Fig. 2; figures in article by Landau et al. (10)), as would be expected if defluorination were occurring. Incubation of 14C-6FDG with hexokinase, triethanolamine buffer, adenosine triphosphate, and MgCl2 showed no evidence of 14C-6FDG phosphorylation. Additionally, rat studies (n = 2) were performed with 3H-6FDG. One hour after injection, rats were euthanized, tissues were excised and homogenized, and activity was extracted (23). The extracts were passed through anion and cation exchange columns, and water eluates contained greater than 90% of the activity (n = 5) (data not shown). Greater than 90% of the eluate activities behaved as 3H-6FDG, as determined by high-performance liquid chromatography (n = 4).
The time courses of activity after 18F-6FDG injection (Fig. 5) were markedly similar to those observed in human skeletal muscle after 11C-3OMG injection in basal and insulin-stimulated conditions (16,17). Moreover, the observed doubling of the skeletal muscle concentration under the high-insulin conditions compared with the basal conditions in the present study was analogous to the doubling reported with 11C-3OMG (16,17).
The insulin-stimulated increase in the skeletal muscle concentration of 18F-6FDG warrants discussion. It is well known that insulin stimulation increases skeletal muscle glucose transport and the intracellular glucose concentration, consistent with the premise that the phosphorylation step has become rate limiting (24). Given that the majority of the tissue space is intracellular, the increase in the 18F-6FDG tissue activity visualized by PET can be explained by 18F-6FDG mirroring glucose. The increase cannot be attributed to mass action because experiments were performed under euglycemic conditions and 18F-6FDG was used as a tracer. In addition, the increased concentration cannot be attributed simply to a change in blood flow because the increase persisted for at least 30 min, at which time flow effects would have subsided. However, an increase in the GLUT4 concentration in the plasma membrane could explain an increased rate of activity accumulation in skeletal muscle after insulin stimulation.
We hypothesize the following as a mechanism explaining the insulin-stimulated increase in the skeletal muscle concentration of 18F-6FDG, while noting that the lack of phosphorylation of 18F-6FDG is its key difference from glucose. Under basal conditions, glucose in skeletal muscle is phosphorylated essentially as rapidly as it is transported into cells, so that the intracellular glucose concentration is low—between 0% and 10% of the interstitial concentration (25,26). Under insulin stimulation, glucose transport is significantly increased, more so than the phosphorylation step of metabolism, so that the intracellular glucose concentration increases (24). This increased intracellular glucose concentration drives the efflux of glucose via GLUTs, making fewer transporters available for 18F-6FDG efflux and thus leading to an increase in the intracellular 18F-6FDG concentration. This hypothesized competition effect is consistent with the insulin-induced increase in the skeletal muscle concentration of 11C-3OMG reported by Bertoldo et al. (16) and Pencek et al. (17) and the increase in the 11C-3OMG intracellular distribution volume reported in another publication by that group (14). Moreover, Nakanishi et al. (27) observed that the 11C-3OMG distribution volume depended on the brain glucose content in a way that could be explained by transport competition. Our hypothesis extends their theory to skeletal muscle, distinguishing between intracellular and interstitial glucose concentrations. Accordingly, in future studies we will measure the intracellular and interstitial concentrations and test our hypothesis.
Besides the results on the distribution of 18F-6FDG, another key result of this work was the demonstration of the methods and conditions under which PET imaging can be done while rats are maintained on a glucose clamp. To the best of our knowledge, this represents the first report of PET imaging of rats during a glucose clamp under basal and insulin-stimulated conditions. In particular, we showed that this procedure can be done under isoflurane anesthesia, which has been reported to only minimally affect glucose metabolism in rats that have fasted (28), although we found that plasma glucose levels varied somewhat during the initial 30 min of anesthesia.
The properties of 18F-6FDG as a tracer of glucose transport are different from those of other labeled glucose tracers because 18F-6FDG can be transported proficiently by both GLUTs and SGLTs. Here we have shown that the tissue uptake of 18F-6FDG is modulated by insulin action, which increases the level of functional GLUT4. That there was significant urinary excretion of 18F-6FDG by rats only when phlorizin (an SGLT blocker) was administered is good evidence that 18F-6FDG is reabsorbed by SGLTs in the proximal tubules of the kidneys. In fact, 18F-6FDG must be transported better by SGLTs than 18F-2FDG given that less 18F-6FDG is excreted under normal conditions and that phlorizin increases the excretion of both (10). Other evidence of transport by SGLTs is that 18F-6FDG is concentrated across intestinal sacs (19).
Although 18F-2FDG is also transported by GLUTs, it is poorly transported by SGLTs (6) because of the replacement of the hydroxyl on carbon-2 by fluorine. 2FDG enters cells via GLUTs and is phosphorylated and trapped, thereby confounding the ability to assess the transport step alone. In the standard 2FDG model, the first tissue compartment represents 2FDG, and the second represents 2FDG-6-phospate. Because interstitial 2FDG and intracellular 2FDG are “lumped together” in the first compartment, there is no rate constant that corresponds to transport. Resolving the transport step alone requires splitting the 2FDG compartment into separate compartments representing interstitial and intracellular tracers. There would also be a compartment for 2FDG-6-phosphate; therefore, the model would have 3 compartments in series, and obtaining precise and reliable values for all of the rate constants from 2FDG data would be problematic. (It is so difficult to estimate values for just 4 rate constants that most studies of 2FDG resort to reporting influx constant [Ki] or other composite parameters.) If, instead, one used 18F-6FDG, only 2 tissue compartments would be required because phosphorylation could be neglected. Because common practice (2-compartment Sokoloff model) (29) is to lump together interstitial 2FDG and intracellular 2FDG in a single compartment, one must interpret K1 and k2 as encoding information about both perfusion and transport. Under some conditions, for example, fasting and low insulin levels, one might assume glucose transport is rate limiting and interpret K1 and k2 in these terms. However, under insulin-stimulated conditions or, moreover, a study comparing different metabolic conditions, such an assumption would be questionable.
3OMG is considered to be the reference glucose transport compound. However, although 3OMG shows uptake in human red blood cells and is insulin responsive (implying that it is recognized by both GLUT1 and GLUT4), its transport by SGLTs is relatively poor. When transport across intestinal sacs was studied, 3OMG was concentrated 8% as well as glucose (19). The affinity of 3OMG for human SGLT1 is 1/12 that of glucose (30), and about half the administered 3OMG is excreted in urine in 5 h (31,32). The poor transport of 18F-2FDG and 3OMG by SGLTs causes poor renal reabsorption and urinary excretion. For a 18F-2FDG PET scan, a significant accumulation of radioactivity in the bladder can make images of the lower abdomen and pelvis difficult to interpret (33). In contrast, with 18F-6FDG, one could assess glucose transport in tissues rich in either GLUTs or SGLTs without artifacts in the pelvic area.
CONCLUSION
We have demonstrated that 18F-6FDG behaves as an insulin-responsive tracer of glucose transport in vivo. The glucose clamp study showed that insulin stimulation increased tracer uptake in skeletal muscle. The analysis for potential metabolites confirmed that 18F-6FDG is not phosphorylated. These properties, in addition to the longer half-life of 18F-6FDG than of 11C-3OMG, suggest that 18F-6FDG can serve as an excellent tracer for imaging glucose transport.
ACKNOWLEDGMENTS
This work is dedicated to the memory of our beloved colleague, Bernard R. Landau. Dr. Landau predicted many of the in vivo properties of 18F-6FDG. We thank Saul M. Genuth, Timothy S. Kern, and Paul R. Ernsberger of Case Western Reserve University for guidance in planning the experiments. We thank Dr. Bhavapriya Vaitheesvaran of Stonybrook University for performing some of the insulin assays. This work was supported by National Institute of Diabetes and Digestive and Kidney Diseases grants DK-14507 and DK-61994 and by the Case Center for Imaging Research. Carotid artery and jugular vein catheters were surgically placed by the Mouse Metabolic Phenotyping Center of Case Western Reserve University, which was supported by grant U24 DK76169.
REFERENCES
- 1.Mokdad AH, Bowman BA, Ford ES, Vinicor F, Marks JS, Koplan JP. The continuing epidemics of obesity and diabetes in the United States. JAMA. 2001;286:1195–1200. doi: 10.1001/jama.286.10.1195. [DOI] [PubMed] [Google Scholar]
- 2.National Institutes of Health [January 7, 2008];Type 2 diabetes fact sheet. http://www.nih.gov/about/researchresultsforthepublic/Type2Diabetes.pdf, 1-7-2008.
- 3.Mokdad AH, Ford ES, Bowman BA, et al. Prevalence of obesity, diabetes, and obesity-related health risk factors, 2001. JAMA. 2003;289:76–79. doi: 10.1001/jama.289.1.76. [DOI] [PubMed] [Google Scholar]
- 4.Cline GW, Petersen KF, Krssak M, et al. Impaired glucose transport as a cause of decreased insulin-stimulated muscle glycogen synthesis in type 2 diabetes. N Engl J Med. 1999;341:240–246. doi: 10.1056/NEJM199907223410404. [DOI] [PubMed] [Google Scholar]
- 5.Petersen KF, Shulman GI. New insights into the pathogenesis of insulin resistance in humans using magnetic resonance spectroscopy. Obesity (Silver Spring) 2006;14(suppl 1):34S–40S. doi: 10.1038/oby.2006.280. [DOI] [PMC free article] [PubMed] [Google Scholar]
- 6.Moran JK, Lee HB, Blaufox MD. Optimization of urinary FDG excretion during PET imaging. J Nucl Med. 1999;40:1352–1357. [PubMed] [Google Scholar]
- 7.Halama JR, Gatley SJ, DeGrado TR, Bernstein DR, Ng CK, Holden JE. Validation of 3-deoxy-3-fluoro-d-glucose as a glucose transport analogue in rat heart. Am J Physiol. 1984;247:H754–H759. doi: 10.1152/ajpheart.1984.247.5.H754. [DOI] [PubMed] [Google Scholar]
- 8.Kwee IL, Nakada T, Card PJ. Noninvasive demonstration of in vivo 3-fluoro-3-deoxy-d-glucose metabolism in rat brain by 19F nuclear magnetic resonance spectroscopy: suitable probe for monitoring cerebral aldose reductase activities. J Neurochem. 1987;49:428–433. doi: 10.1111/j.1471-4159.1987.tb02883.x. [DOI] [PubMed] [Google Scholar]
- 9.Berkowitz BA, Moriyama T, Fales HM, Byrd RA, Balaban RS. In vivo metabolism of 3-deoxy-3-fluoro-d-glucose. J Biol Chem. 1990;265:12417–12423. [PubMed] [Google Scholar]
- 10.Landau BR, Spring-Robinson CL, Muzic RF, Jr, et al. 6-Fluoro-6-deoxy-d-glucose as a tracer of glucose transport. Am J Physiol Endocrinol Metab. 2007;293:E237–E245. doi: 10.1152/ajpendo.00022.2007. [DOI] [PubMed] [Google Scholar]
- 11.Vyska K, Magloire JR, Freundlieb C, et al. In vivo determination of the kinetic parameters of glucose transport in the human brain using 11C-methyl-d-glucose (CMG) and dynamic positron emission tomography (dPET). Eur J Nucl Med. 1985;11:97–106. doi: 10.1007/BF00265041. [DOI] [PubMed] [Google Scholar]
- 12.Brooks DJ, Gibbs JS, Sharp P, et al. Regional cerebral glucose transport in insulin-dependent diabetic patients studied using [11C]3-O-methyl-d-glucose and positron emission tomography. J Cereb Blood Flow Metab. 1986;6:240–244. doi: 10.1038/jcbfm.1986.37. [DOI] [PubMed] [Google Scholar]
- 13.Brooks DJ, Beaney RP, Lammertsma AA, et al. Glucose transport across the blood-brain barrier in normal human subjects and patients with cerebral tumours studied using [11C]3-O-methyl-d-glucose and positron emission tomography. J Cereb Blood Flow Metab. 1986;6:230–239. doi: 10.1038/jcbfm.1986.36. [DOI] [PubMed] [Google Scholar]
- 14.Bertoldo A, Price J, Mathis C, et al. Quantitative assessment of glucose transport in human skeletal muscle: dynamic positron emission tomography imaging of [O-methyl-11C]3-O-methyl-d-glucose. J Clin Endocrinol Metab. 2005;90:1752–1759. doi: 10.1210/jc.2004-1092. [DOI] [PubMed] [Google Scholar]
- 15.Bingham EM, Dunn JT, Smith D, et al. Differential changes in brain glucose metabolism during hypoglycaemia accompany loss of hypoglycaemia awareness in men with type 1 diabetes mellitus: an [11C]-3-O-methyl-d-glucose PET study. Diabetologia. 2005;48:2080–2089. doi: 10.1007/s00125-005-1900-6. [DOI] [PubMed] [Google Scholar]
- 16.Bertoldo A, Pencek RR, Azuma K, et al. Interactions between delivery, transport, and phosphorylation of glucose in governing uptake into human skeletal muscle. Diabetes. 2006;55:3028–3037. doi: 10.2337/db06-0762. [DOI] [PubMed] [Google Scholar]
- 17.Pencek RR, Bertoldo A, Price J, Kelley C, Cobelli C, Kelley DE. Dose-responsive insulin regulation of glucose transport in human skeletal muscle. Am J Physiol Endocrinol Metab. 2006;290:E1124–E1130. doi: 10.1152/ajpendo.00598.2004. [DOI] [PubMed] [Google Scholar]
- 18.Neal TR, Schumann WC, Berridge MS, Landau BR. Synthesis of [18F]-deoxy-d-fluoro-d-glucose ([18F]6FDG), a potential tracer of glucose transport. J Labelled Comp Radiopharm. 2005;48:845–854. [Google Scholar]
- 19.Wilson TH, Landau BR. Specificity of sugar transport by the intestine of the hamster. Am J Physiol. 1960;198:99–102. doi: 10.1152/ajplegacy.1960.198.1.99. [DOI] [PubMed] [Google Scholar]
- 20.Knoess C, Siegel S, Smith A, et al. Performance evaluation of the microPET R4 PET scanner for rodents. Eur J Nucl Med Mol Imaging. 2003;30:737–747. doi: 10.1007/s00259-002-1052-6. [DOI] [PubMed] [Google Scholar]
- 21.Salinas CA, Pagel M, Muzic RF., Jr 2004;3:213–214. [Google Scholar]
- 22.Muzic RF, Jr, Cornelius S. 2001;42:636–645. [PubMed] [Google Scholar]
- 23.Dienel GA, Cruz NF, Mori K, Sokoloff L. 1990;54:1440–1448. doi: 10.1111/j.1471-4159.1990.tb01981.x. [DOI] [PubMed] [Google Scholar]
- 24.Morgan HE, Neely JR, Kira Y. 1984;79:292–299. doi: 10.1007/BF01908029. [DOI] [PubMed] [Google Scholar]
- 25.Cline GW, Jucker BM, Trajanoski Z, Rennings AJ, Shulman GI. A novel 13C NMR method to assess intracellular glucose concentration in muscle, in vivo. Am J Physiol. 1998;274:E381–E389. doi: 10.1152/ajpendo.1998.274.2.E381. [DOI] [PubMed] [Google Scholar]
- 26.Pendergrass M, Bertoldo A, Bonadonna R, et al. Muscle glucose transport and phosphorylation in type 2 diabetic, obese nondiabetic, and genetically predisposed individuals. Am J Physiol Endocrinol Metab. 2007;292:E92–E100. doi: 10.1152/ajpendo.00617.2005. [DOI] [PubMed] [Google Scholar]
- 27.Nakanishi H, Cruz NF, Adachi K, Sokoloff L, Dienel GA. Influence of glucose supply and demand on determination of brain glucose content with labeled methylglucose. J Cereb Blood Flow Metab. 1996;16:439–449. doi: 10.1097/00004647-199605000-00010. [DOI] [PubMed] [Google Scholar]
- 28.Saha JK, Xia J, Grondin JM, Engle SK, Jakubowski JA. Acute hyperglycemia induced by ketamine/xylazine anesthesia in rats: mechanisms and implications for preclinical models. Exp Biol Med (Maywood) 2005;230:777–784. doi: 10.1177/153537020523001012. [DOI] [PubMed] [Google Scholar]
- 29.Sokoloff L, Reivich M, Kennedy C, et al. The [14C]deoxyglucose method for the measurement of local cerebral glucose utilization: theory, procedure, and normal values in the conscious and anesthetized albino rat. J Neurochem. 1977;28:897–916. doi: 10.1111/j.1471-4159.1977.tb10649.x. [DOI] [PubMed] [Google Scholar]
- 30.Diez-Sampedro A, Wright EM, Hirayama BA. Residue 457 controls sugar binding and transport in the Na1/glucose cotransporter. J Biol Chem. 2001;276:49188–49194. doi: 10.1074/jbc.M108286200. [DOI] [PubMed] [Google Scholar]
- 31.Lang JA, Gisolfi CV, Lambert GP. Effect of exercise intensity on active and passive glucose absorption. Int J Sport Nutr Exerc Metab. 2006;16:485–493. doi: 10.1123/ijsnem.16.5.485. [DOI] [PubMed] [Google Scholar]
- 32.Zuckerman MJ, Menzies IS, Ho H, et al. Assessment of intestinal permeability and absorption in cirrhotic patients with ascites using combined sugar probes. Dig Dis Sci. 2004;49:621–626. doi: 10.1023/b:ddas.0000026307.56909.21. [DOI] [PubMed] [Google Scholar]
- 33.Miraldi F, Vesselle H, Faulhaber PF, Adler LP, Leisure GP. Elimination of artifactual accumulation of FDG in PET imaging of colorectal cancer. Clin Nucl Med. 1998;23:3–7. doi: 10.1097/00003072-199801000-00002. [DOI] [PubMed] [Google Scholar]


