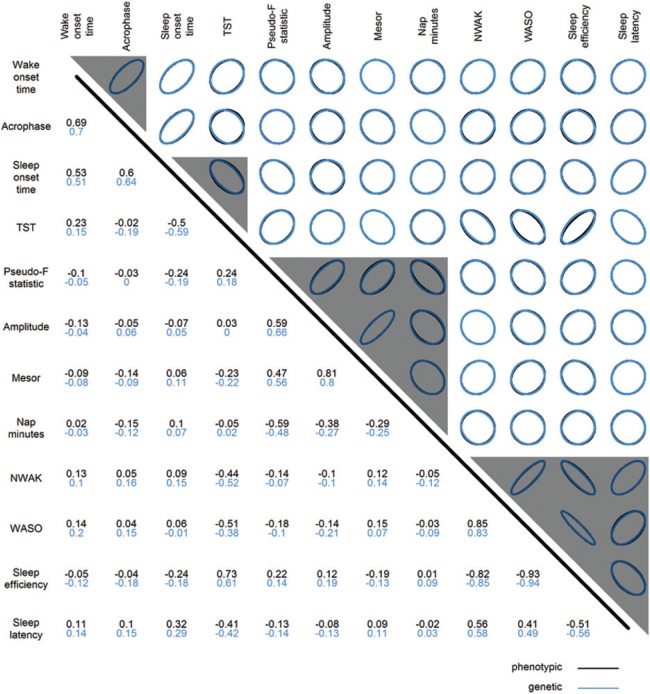
Figure 4.
Phenotypic and genetic correlation of actigraphic sleep and activity rhythm traits. The upper triangle depicts correlation graphically, and the lower triangle shows correlation values, with phenotypic correlations in black and genetic correlations in blue. Phenotypic correlations (Pearson's r) are calculated using The Osteoporotic Fractures in Men study data; similar results are seen using The Study of Osteoporotic Fractures phenotypic data. Genetic correlations (Pearson's r) are based on the meta-analysis single nucleotide polymorphisms test-statistics using the additive genetic model. A correlation of 0 is depicted with a circle, and correlations approaching 1 or -1 are depicted with more narrow ellipses to the right or left, respectively. Gray triangles mark the clusters formed by hierarchical cluster analysis of genetic associations. NWAK, number of awakenings; TST, total sleep time; WASO, wake after sleep onset.

