
Figure 5.
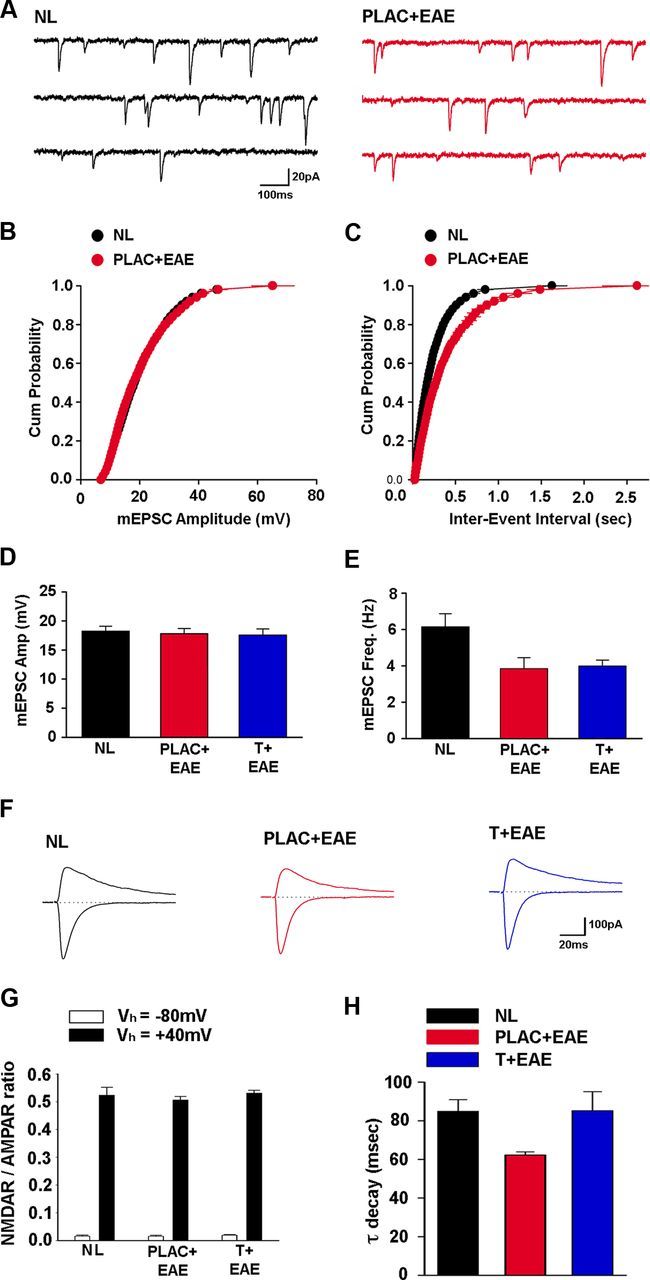
AMPAR-mediated synaptic current frequency and NMDAR-mediated synaptic current decay rate are reduced during EAE. A, mEPSCs were recorded at −70 mV in the presence of 1.0 μm TTX and 100 μm picrotoxin. B, mEPSC amplitude cumulative probability distribution was not significantly different for cells from healthy control mice (NL, black, n = 17 cells from 5 mice) and placebo-treated EAE mice (PLAC + EAE, red, n = 9 cells from 4 mice). C, The interevent interval cumulative probability distribution in cells from placebo-treated EAE (PLAC + EAE, red) mice was shifted right, compared with healthy control (NL, black) mice, indicating longer interevent intervals between mEPSCs. D, Mean mEPSC amplitude was not considerably altered in cells from placebo- or testosterone-treated mice with EAE (T + EAE, blue, n = 13 cells from 4 mice), compared with healthy control mice. E, mEPSC frequency was strongly reduced, however, in cells from placebo-treated EAE mice and testosterone-treated EAE mice compared with mEPSC frequency in cells from healthy control mice, where *p < 0.05, one-way ANOVA followed by Dunnet's test comparisons to control. F, Examples of evoked EPSCs recorded at holding potentials of −80 mV and +40 mV in CA1 pyramidal cells from healthy control (NL, black), placebo-treated EAE (PLAC + EAE, red), and testosterone-treated EAE (T + EAE, blue) mice. G, NMDA receptor/AMPA receptor ratios of evoked EPSCs recorded at either −80 mV or +40 mV are not altered in EAE. H, The decay of NMDA receptor-mediated EPSCs recorded at +40 mV was significantly faster in cells from placebo-treated EAE mice (PLAC + EAE, red, n = 11 cells from 4 mice) compared with healthy control mice (NL, black, n = 12 cells from 5 mice). Interestingly, NMDAR-mediated synaptic current decay rate was not significantly different in testosterone-treated EAE mice (T + EAE, blue, n = 12 cells from 4 mice), compared with healthy control mice, where *p < 0.05, one-way ANOVA followed by Dunnet's test comparisons to control.