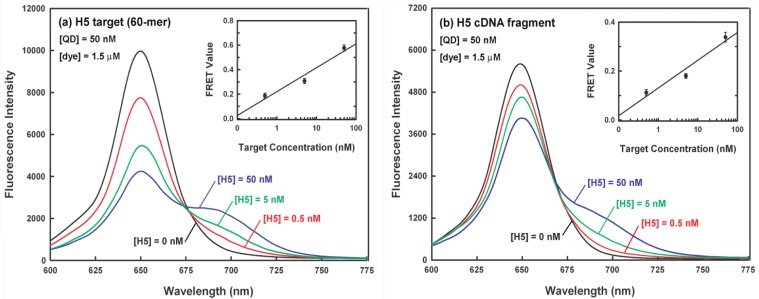
Figure 6.
FRET detection of different amounts of (a) 60-mer H5 target (0–50 nM) and (b) 630-nt H5 cDNA fragment target (0–50 nM) with 50 nM FRET donor (QD) and 1.5 μM FRET acceptor (dye). The insets of (a) and (b) display the dose response relationship between the average FRET value from triplicate experiments and the target concentration.

