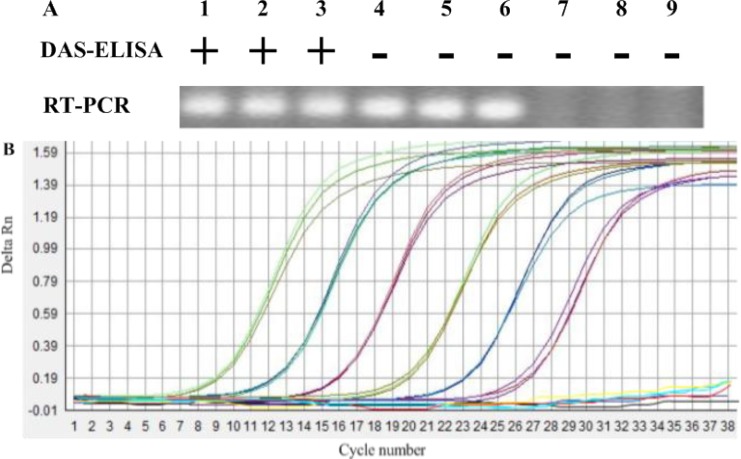
Figure 2.
The detection of TMV in plant by the assays of DAS-ELISA (A), RT-PCR (A) and IC-real-time RT-PCR (B). Lanes 1 to 6 are dilutions at 1:101, 1:102, 1:103, 1:104, 1:105 and 1:106 (1 mL, w/v, per g soil) of naturally TMV-infected leaf saps, respectively, and, Lanes 7 to 9 are the template of ToMV-contaminated soil, TMV-free soil, and healthy leaf extract, respectively. “+” represents positive result of DAS-ELISA for detecting TMV, “−” represents negative result of DAS-ELISA for detecting TMV. (B) Sensitivity of the IC-real-time RT-PCR assay as monitored by amplified curve. Shown from left to right are the curves of decreasing TMV-infected leaf saps at 1:101, 1:102, 1:103, 1:104, 1:105 and 1:106 (1 mL, w/v, per g soil) dilutions. The curves roughly parallel to the X axis are TMV from ToMV-contaminated soil, TMV-free soil, and healthy leaf extract, respectively.

