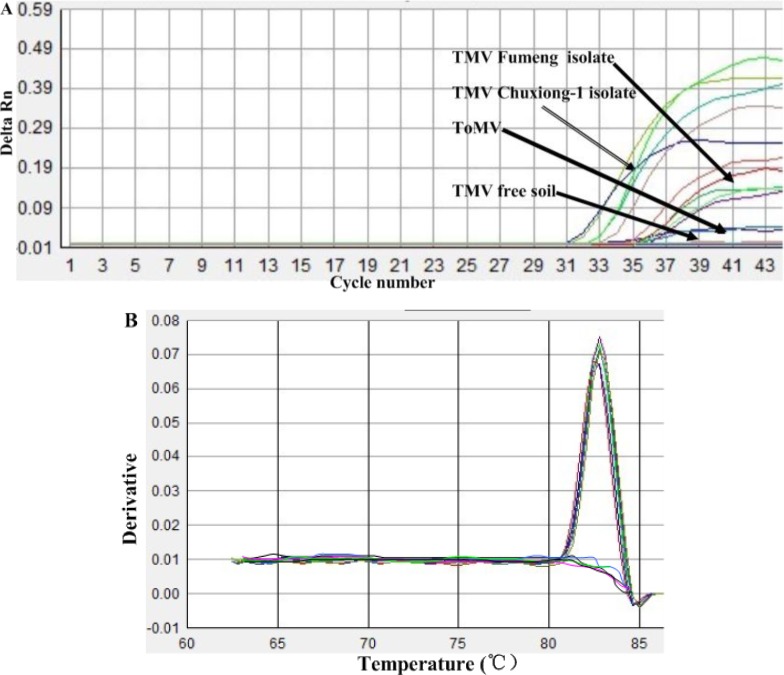
Figure 3.
The specificity of IC-real-time RT-PCR for the detection of TMV in soil. The specificity of the IC-real-time RT-PCR assay as monitored by amplified curve (A) and melting curves (B) for TMV CP gene. (A) Amplified curve shown from left to right are the curves of TMV Fumeng isolate, TMV Chuxiong-1 isolate, ToMV and TMV-free soil. (B) Melting curves for TMV CP gene with single peak from three replicates of two different templates including TMV leaves and viruliferous soils.

