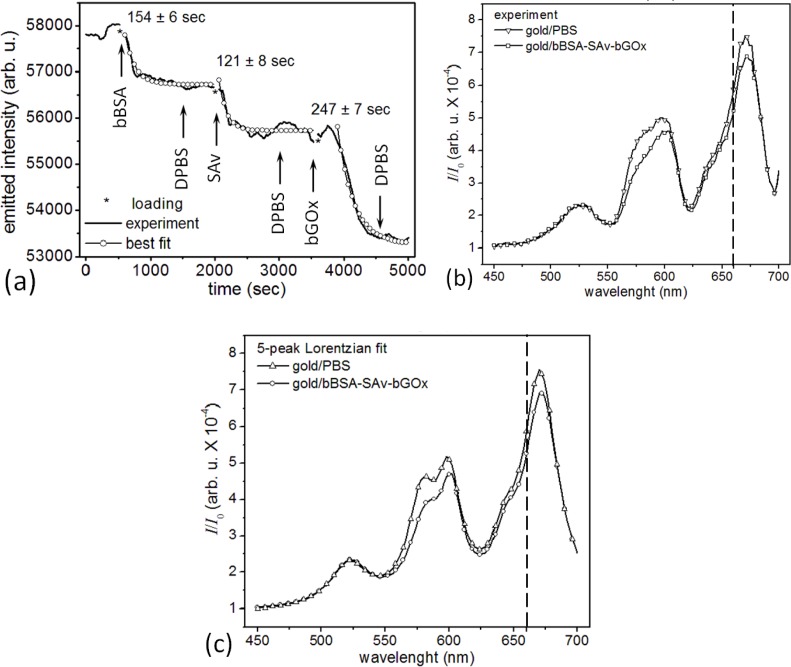
Figure 6.
(a) Monitoring the successive binding of three molecular layers to a microsensor: a microsensor’s emitted-light intensity at 660 nm (dashed line in Figure 6(b) and 6(c)) during: (i) covalent binding of 10-μM bBSA solution to the microsensor’s bare-gold surface, (ii) subsequent binding of a 10-μM SAv solution to the microsensor-bound bBSA, (iii) subsequent binding of a 100-nM bGOx solution to the microsensor-bound bBSA-SAv complex. (◯) exponential-decay best-fits to the emitted-light intensities: R2(bBSA) = 0.91, R2(SAv) = 0.78, R2(bGOx) = 0.97. The sample flow rate was ≈0.2 nL/s and the solution temperature was 24.0 ± 0.1 °C. *No signal was recorded during sample loading. (b) Spectra of a microsensor consisting of a ∅780 polystyrene nanosphere covered uniformly with a ≈150 nm gold film and excited with white light from a microscope illuminator (0.3 NA), showing the four main visible microcavity resonances (i) (▾) spectrum for the bare-gold microsensor in DPBS, (ii) (□) spectrum for the microsensor after deposition of bBSA-SAv-bGOx. (c) Multi-peak Lorentzian fits of the spectra in Figure 6(b): (i) (▴) for the bare-gold microsensor in DPBS, R2(DPBS) = 0.99, and (ii) (◯) for the microsensor after deposition of bBSA-SAv-bGOx R2(bBSA-SAv-bGOx) = 0.99.

