
Figure 2.
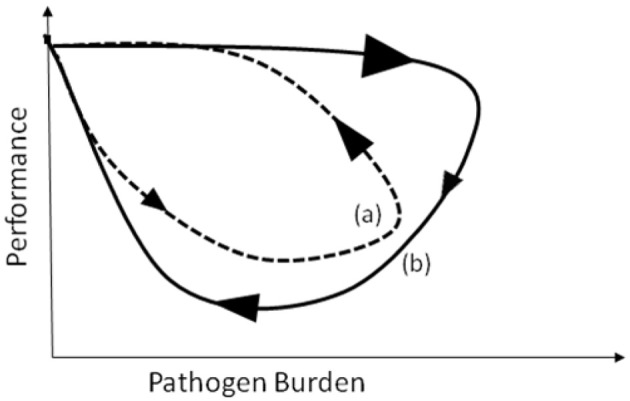
Schematic figure representing pathogen burden–performance trajectories for two individuals (a) and (b) with different resistance and tolerance mechanisms. The direction and size of the arrows indicate the direction and velocity at which trajectories evolve over time.