
Figure 4.
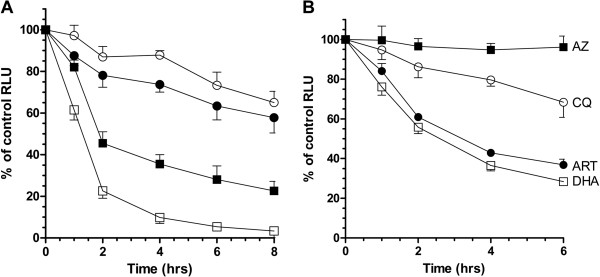
Exploring the immediate dynamic response of bioluminescence and fluorescence assays of drug activity. (A) Plot of the time-dependent changes in relative RLU (bioluminescent and fluorescence when compared to untreated control) measured from trophozoite stage Dd2luc (2% parasitaemia, 2% HCT) exposed to a supralethal 1 μM dose of actinomycin D (filled symbol) or cyclohexamide (open symbol). The fraction of mean RLU ± stdev (n = 3) at each timepoint are shown for a luciferase assay (square) or MSF assay (circle). (B) Plot of the time-dependent changes in mean fraction of luciferase RLU ± stdev (n = 3) exposed to 3xIC50 doses of the indicated anti-malarial drug; artemether (ART), azithromycin (AZ), dihydroartemisinin (DHA) and chloroquine (CQ).