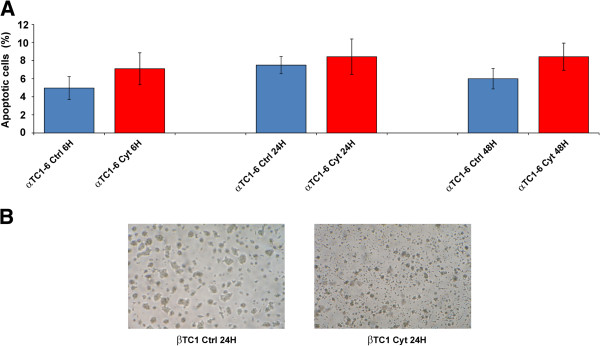
Figure 1.

Apoptosis of αTC1-6 and βTC1 after treatment with cytokines. (A) Annexin V flow cytometric analysis of apoptosis in αTC1-6 treated with IFN-γ, IL-1β, TNF-α for 6, 24, 48 h and in matched untreated controls. Values represent the percentage of apoptotic cells. Data are presented as mean ± S.D. of three independent experiments (n = 3). (B) Microphotographs of βTC1 at steady state (left) and 24 h PT (right). Cell shrinkage and irregular morphology are evident in βTC1 after 24 h of treatment. Representative pictures are shown from three independent experiments (n = 3).
