
Figure 1. Metabolic cost and performance index.
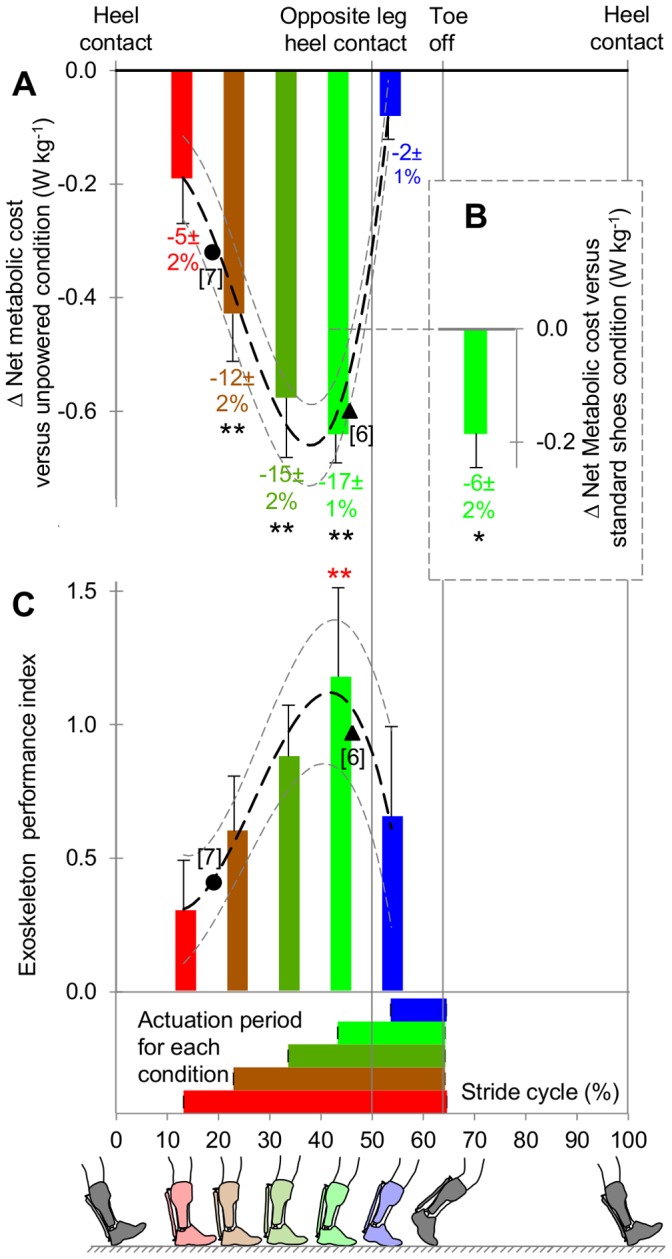
(A) Δ Net metabolic cost versus unpowered condition. Asterisks indicate significant differences versus unpowered condition. (B), 43% condition versus without exoskeleton. Asterisk indicates significant difference. (C) Performance index. Asterisks indicate significant difference versus 13% condition. Numbers below bars indicate differences expressed as percentages of net metabolic cost in unpowered or standard shoes condition. Horizontal bars indicate actuation duration. Vertical lines indicate heel contact and toe off. Filled circles (•) and triangles (▴) respectively indicate results derived [22], [35] from Sawicki and Ferris [7] and Norris et al. [6] (young adults population). Error bars indicate inter-subject s.e.m. Black and grey dashed lines indicate mean±s.e.m. of third-order polynomial curve fit. **p≤0.01, *p≤0.05.