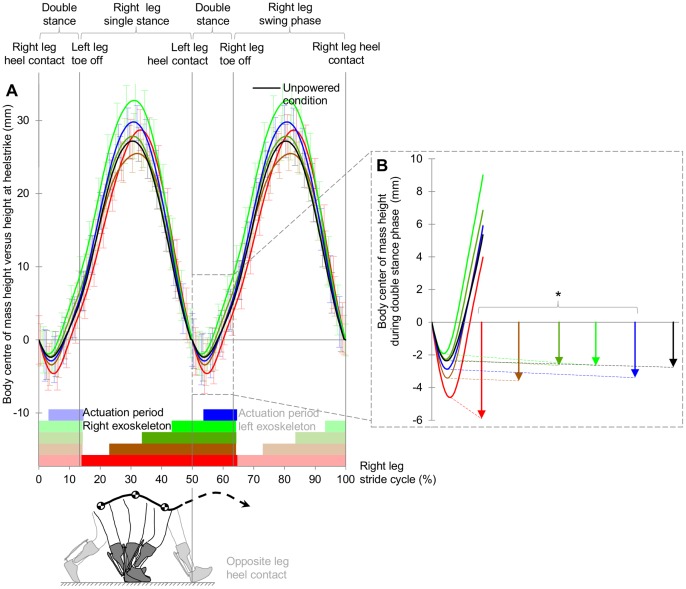
Figure 2. Body centre of mass (COM) height.
(A) COM height versus height at heelstrike during right leg stride cycle. Error bars indicate inter-subject s.e.m. Opaque horizontal bars indicate actuation duration of right leg exoskeleton. Transparent bars indicate the actuation duration of opposite leg exoskeleton. Vertical lines delimit single & double stance phases. (B) COM height during double stance phase. Arrows indicate COM drop after heel contact. It can be noted that the arrows are slightly larger than the minima of the lines in the chart. This due to the temporal variation of the occurrence of minimum COM height is which is not shown in the lines in the chart as these only show the mean evolution of COM height. Asterisk indicates significant Pearson’s correlation between Δ COM drop versus unpowered condition and Δ net metabolic cost versus unpowered condition. Black line and arrow indicate unpowered condition. *p≤0.05.

