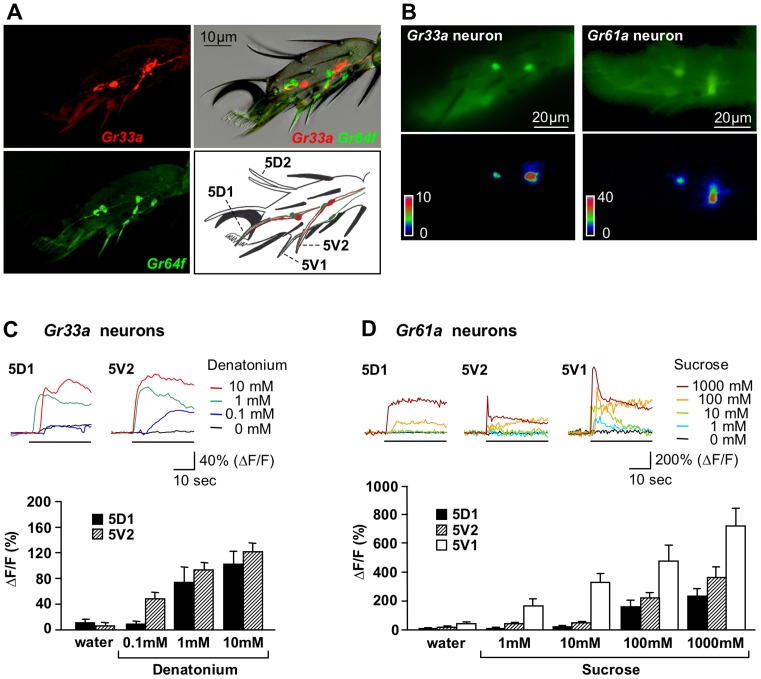
Figure 2. Concentration-dependent Ca2+ responses of bitter and sweet neurons.
(A) Expression of Gr33aGAL4 and Gr64fLexA in GRNs of the fifth tarsal segment. Gr64fLexA is completely co-expressed with Gr61a-GAL4 (JS and HA, unpublished). The image at the top right shows live expression of mCD8RFP and rCD2GFP in bitter/high salt (red) and sweet neurons (green), respectively, laid over the phase-contrast image. Identification of neural processes is possible in the images where the two fluorescent markers are visualized separately. Note that the 5V1 sensilla contain only a Gr64f, but not a Gr33a- expressing neuron. The drawing identifies each of the chemosensory sensilla. Also, only one chemosensory bristle/neuron of each pair is visible from a side view, with the exception of 5D2, which harbors neither a Gr33aGAL4 nor a Gr64fLexA Gr expressing neuron. The single, long sensilla at the tip (above the claw) has a morphology typical of chemosensory bristles, but neither of the drivers is expressed in its associated neurons. Mechanosensory bristles are shown in black. (B) Images of bitter/high salt (Gr33a) and sweet neurons (Gr61a) expressing UAS-GCaMP3.0 in the 5th tarsal segment of forelegs. The upper panels show tarsal neurons labeled with Gr33aGAL4/UAS-GCaMP3.0 (left) and Gr61a-GAL4/UAS-GCaMP3.0 (right), respectively, before application of ligand. The lower panel shows the increase of fluorescence (ΔF) coded as pseudocolor images focused on one of the neurons of each leg after application of 1 mM denatonium and 100 mM sucrose, respectively. (C) Dosage dependent intracellular calcium changes (%ΔF/F) of representative samples in 5D1- and 5V2- associated bitter/high salt neurons (top graph). The black line indicates stimulus application. Average of maximum responses for the pair 5D1- associated neurons were similar and pooled, as were the responses for the pair 5V2- associated neurons (bottom graph). Genotype: Gr33aGAL4/UAS-GCaMP3.0. 3<n<12; ANOVA: * p<0.05, ** p<0.001. (D) Dosage dependent intracellular calcium changes (%ΔF/F) of representative samples in the 5D1-, 5V1- and 5V2- associated sweet neurons (top graph). The black line indicates stimulus application. Average of maximum responses for neurons of a given pair were similar and therefore pooled (bottom graph). Genotype: Gr61a-GAL4/UAS-GCaMP3.0. 7<n<12; ANOVA: * p<0.05, ** p<0.001.

