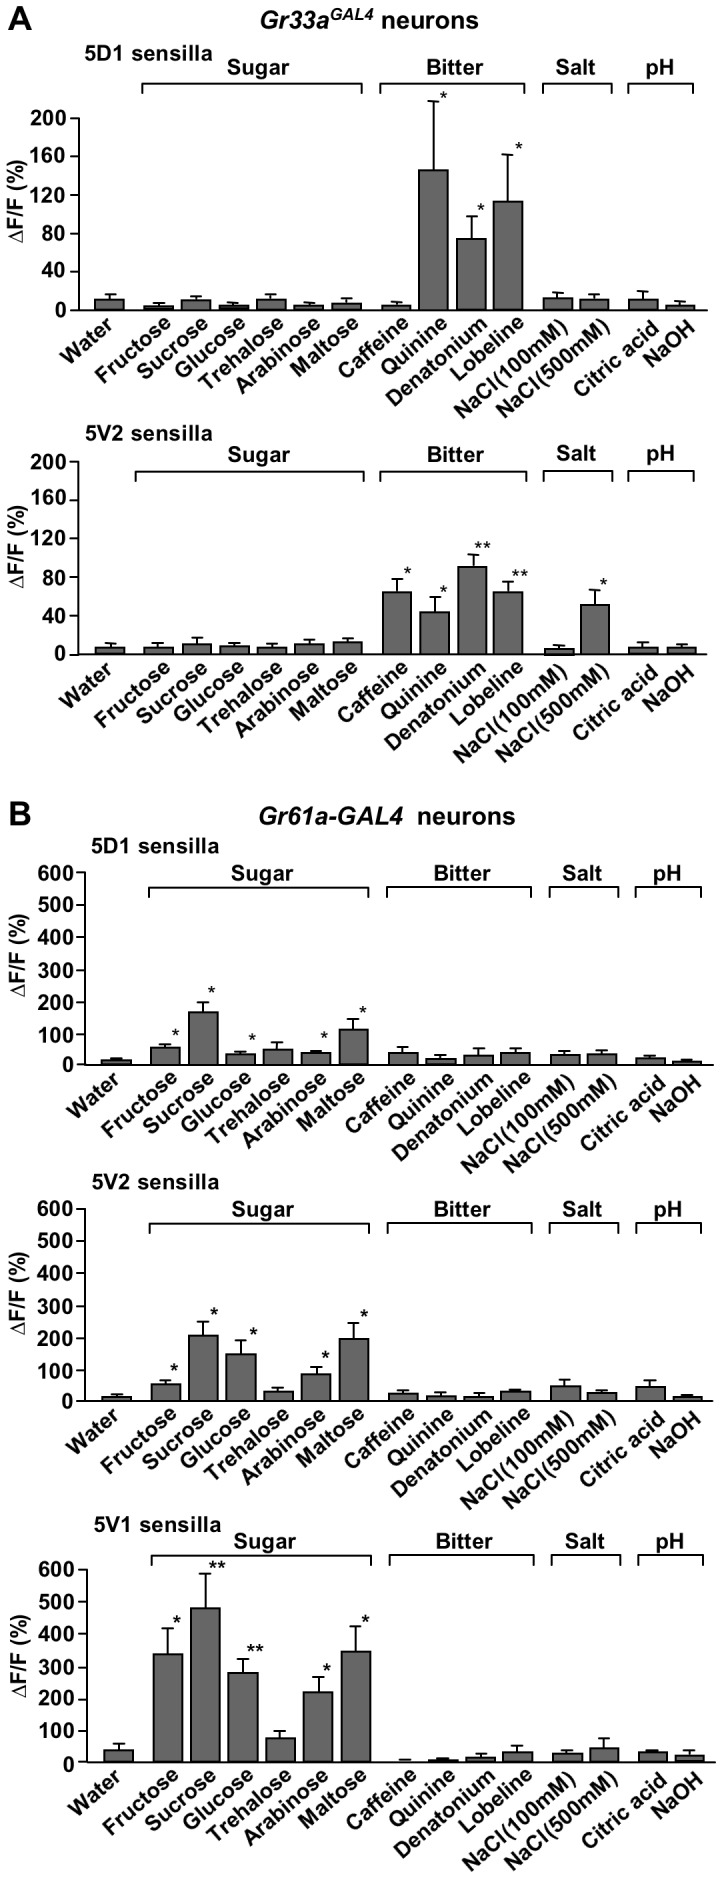
Figure 3. Subtypes of neurons within a taste modality show different response profiles.

Ca2+ responses of Gr33aGAL4 (A) and Gr61a-GAL4 expressing neurons, stimulated by various sugars, bitter compounds, low (100 mM) and high (500 mM) NaCl, acidic (citric acid, pH 2.5) and basic (NaOH, pH 12) solutions. Concentrations were 100 mM for sugars, 10 mM for caffeine and 1 mM for quinine, denatonium and lobeline. (A) All Gr33aGAL4 neurons respond to all bitter compounds tested. Note that the intensity of the response is different in the two types of neurons: The 5D1- associated neurons respond best to quinine, followed by lobeline and denatonium, but do not respond to caffeine and high salt, while the 5V2- associated neurons respond best to denatonium, followed by caffeine and lobeline, high salt and quinine. Note that six 5V2- associated neurons barely responded to quinine (5.2+/−1.3), while eleven responded robustly (ΔF/F = 59.6+/−11.3). Neither the 5D1- nor the 5V2- associated bitter/high neurons respond to sugars, high and low pH or low salt. 3<n<17 for bitter compounds; 4<n<8 for all other compounds. ANOVA: * p<0.05, ** p<0.001. (B) All Gr61a-GAL4 expressing sweet neurons respond to sugars, but not to other chemicals. Absolute response is largest in 5V1- associated neurons, followed by 5V2- and 5D1- associated neurons. Also note that the relative intensity to various sugars is different in the three sweet neurons (for details, see text). 7<n<12 for sugars; 3<n<7 for all other compounds. ANOVA: * p<0.05, ** p<0.001.
