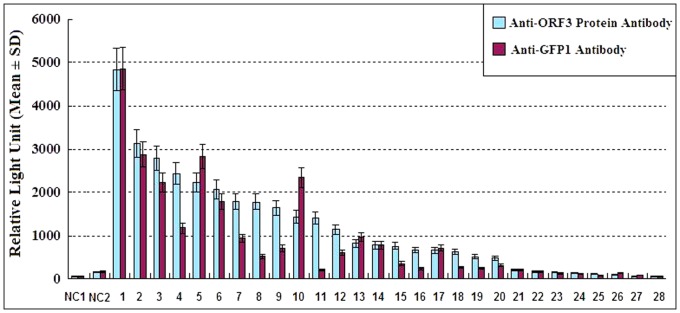
Figure 1. Chemiluminescent detection of protein-protein interactions by co-immuno precipitation.

On the x-axis, “NC1 and NC2” represent 293 cell lysate and negative control; “1∼28” represent FTL, HP, APCS, APOH, NR0B2, AMBP, VTN, TF, MT2A, COX2, CD151, HPX, IGFBP4, FXN, FGA, ALDOB, HSPA8, CYP2E1, SERPINC1, CD63, RGS19, FGB, NAT1, DCN, TSG101,CXCL10, HGD and MAT1A. In the co-immunoprecipitation, the interacting protein complexes were precipitated by both Anti-HEV ORF3 polyclonal antibody(indicated by light blue squares) and GFP1 polyclonal antibody (indicated by magenta squares)., The negative controls were precipitated by Anti-AcGFP antibody.
