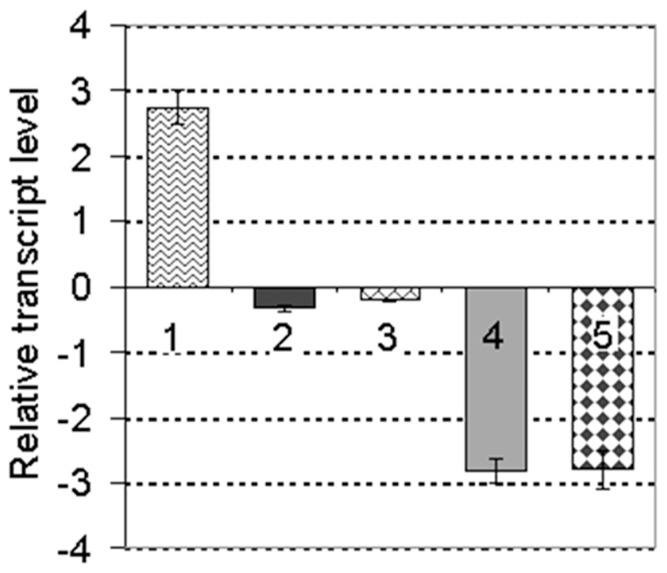
Figure 1. Expression of ssbXoc is induced in rice suspension cells.
Real-time quantitative PCR analysis of ssbXoc transcript levels in X. oryzae pv. oryzicola wild-type RS105 and mutants RΔhrpG and RΔhrpX. Strains were grown in NB or rice suspension cells, and designated as (−) and (+), respectively. The ratios (shown in units of log2) reflect ssbXoc transcript levels between different strains in two different growth conditions. 1. +RS105/−RS105; 2. −RΔhrpG/−RS105; 3. −RΔhrpX/−RS105; 4. +RΔhrpG/+RS105; 5. +RΔhrpX/+RS105. Data represent the means ± standard deviations (SD) from three replicates.

