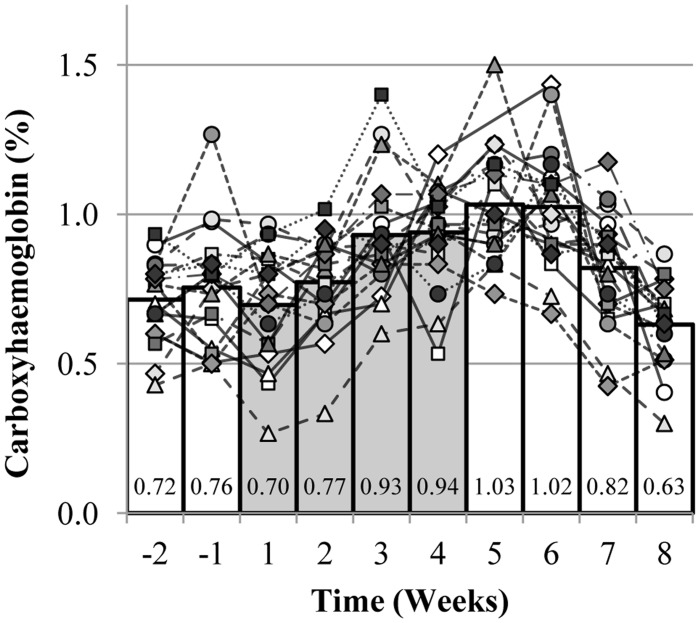
Figure 2. Individual changes in carboxyhaemoglobin.
Each line corresponds to one subject. Individual mean value was calculated when more than one blood sample was collected per week. The bar graphs represent the mean values of the 19 subjects. The grey bars represent the 4 weeks of rHuEpo administration.

