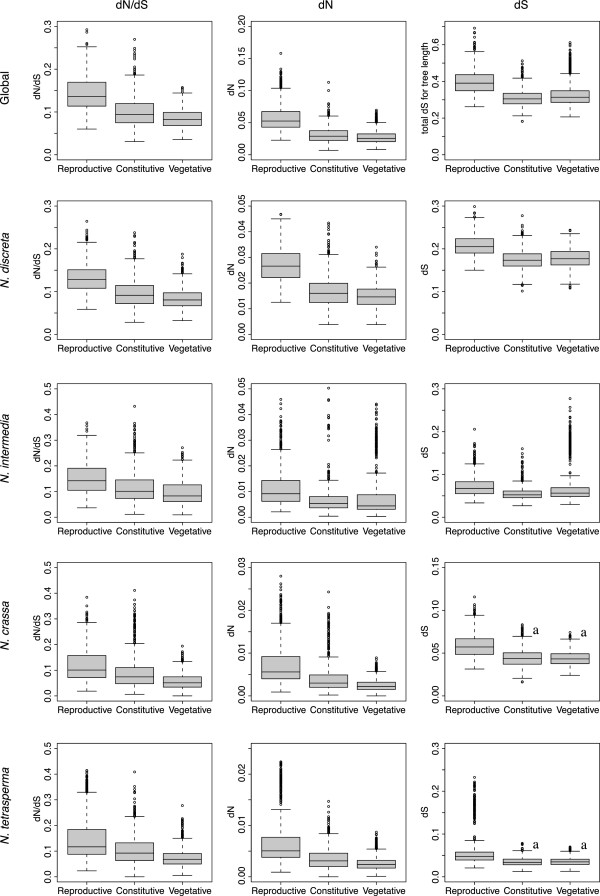
Figure 1.
Boxplots of the distribution of the estimates of dN, dS and dN/dS for the 1000 bootstrap replicates for each gene category. Data is shown for both the global estimate (one-ratio model in codeml) and for each separate branch (two-ratio model with the specified branch as foreground). Boxes represent the second and third quantile of the estimates and whiskers shows the lowest and highest estimates, excluding outliers. “a” indicates that the two distributions are not significantly different from each other. For all other comparisons P < 0.001. Outliers are shown as circles.

