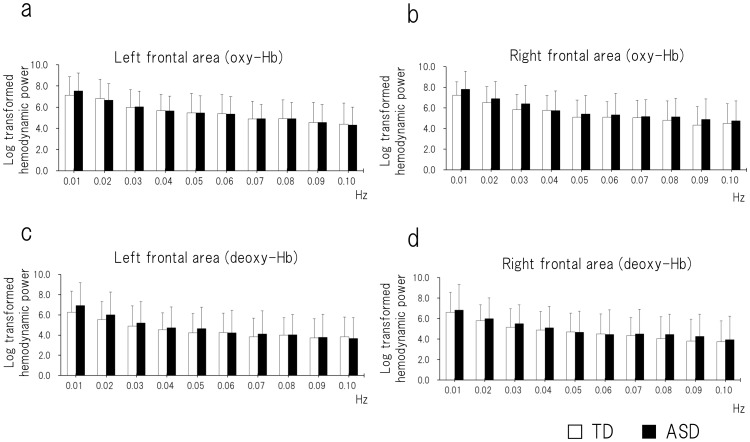
Figure 2. The absolute power value of the hemodynamic fluctuation.
For ASD and TD children, the hemodynamic spectra were calculated with the fast Fourier transform from 0.01 to 0.10 Hz with a spectral resolution of 0.01 Hz. (a) Oxy-Hb in the left frontal area. (b) Oxy-Hb in the right frontal area. (c) Deoxy-Hb in the left frontal area. (d) Deoxy-Hb in the right frontal area. There was no significant difference between ASD and TD children at any frequency point. ASD, autism spectrum disorder; TD, typically developing.

