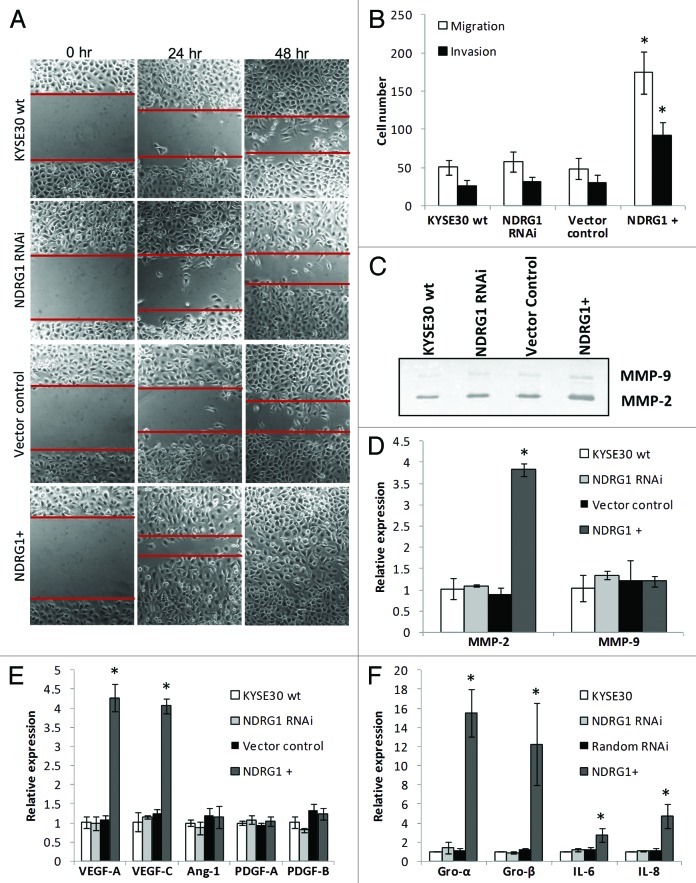
Figure 2. The effect of NDRG1 on cell migration, invasion and expression of angiogenic cytokines. (A) Representative images (100 × magnification) of the scratch/wound-healing assay. The scratched “gaps” are highlighted with black lines. (B) Transwell migration and invasion assay. Cells that migrated through plain (migration) or Matrigel coated (invasion) porous membranes were quantified 48 h after seeding. (C) Gelatin zymography to detect gelatinases MMP-2 and MMP-9 activity. An aliquot of concentrated culture media representative of the same number of KYSE30 wild type cells and transfectants was subjected to the zymography assay. One of the three independent experiments is shown. (D) Quantitative real-time RT-PCR to determine the effect of NDRG1 on the mRNA levels of MMP-2 and MMP-9. The expression has been normalized to β-actin mRNA. (E and F) The mRNA levels of VEGF-A, VEGF-C, Angiopiotein-1 (Ang-1), PDGF-A, PDGF-B, GRO-α/CXCL1, GRO-β/CXCL-2, IL-6/INF-β and IL-8/CXCL-8 were determined by quantitative real-time RT-PCR. Expression has been normalized to β-actin mRNA. Columns, mean of the normalized data from three independent experiments; Bars, ± SD; * p < 0.05 vs. wild type control.

An official website of the United States government
Here's how you know
Official websites use .gov
A
.gov website belongs to an official
government organization in the United States.
Secure .gov websites use HTTPS
A lock (
) or https:// means you've safely
connected to the .gov website. Share sensitive
information only on official, secure websites.
