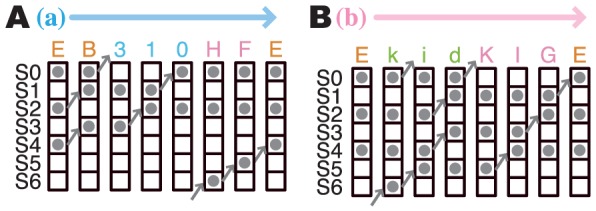
Figure 5. Schematic diagrams of ion conduction cycles and passage times of state transitions.

Examples of schematic diagrams of ion conduction paths in each of the two major ways: via the two-ion states (A), and via the four-ion states (B). Each character shown means each ion-binding state, as shown in Fig. 3.
