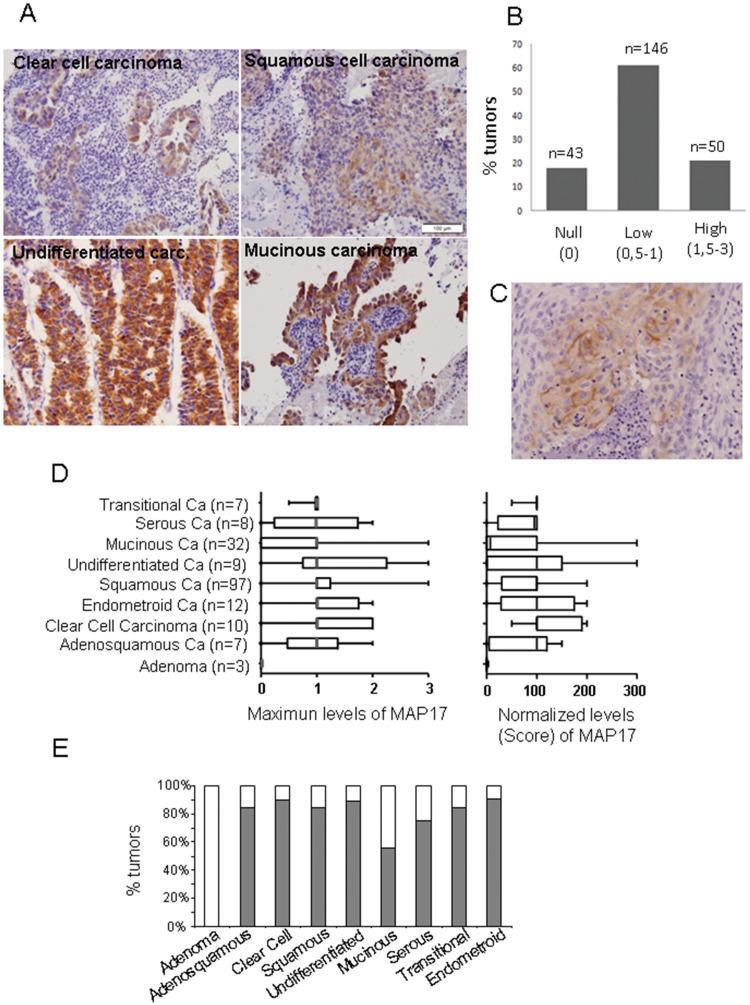
Figure 2. MAP17 overexpression in cervical tumors.
A) Representative images of MAP17 immunostaining are shown for different tumor types. B) A graph is shown representing the percentage of cervical tumors with different MAP17 levels. C) Immunostaining was performed showing membrane-only distribution of MAP17. D) The distribution of the MAP17 expression levels among different cervical tumor types is shown. The maximum-levels graph refers to the maximum staining intensity observed in any part of the tumor (scale from 0 to 3). The normalized-levels (score) graph refers to maximum levels (0–3) scored by the percentage of cells (0–100). The normalized levels were obtained by multiplying the percentage of cells by the level of intensity observed. E) A graph representing the percentage of MAP17-positive tumors by tumor subtype is shown.

