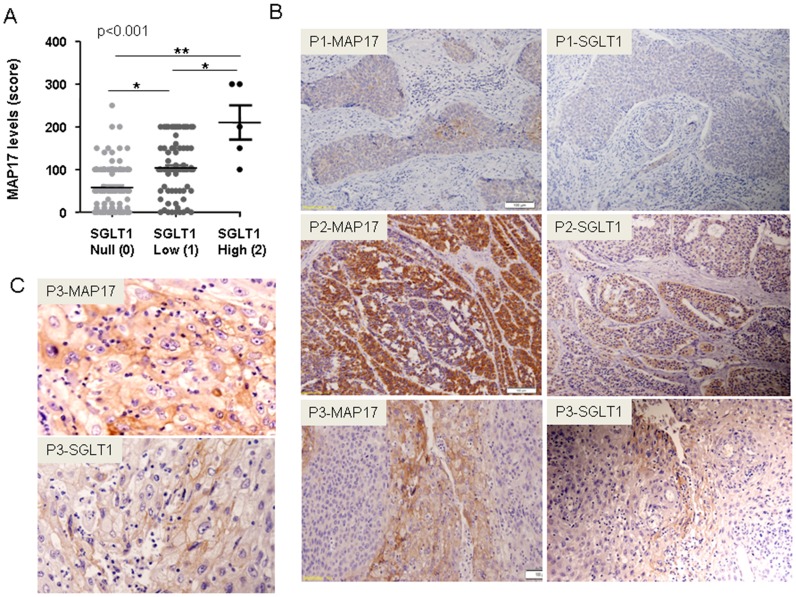
Figure 4. The correlation between MAP17 and SGLT1 expression levels in the same tumor samples.
A) A graph is shown depicting MAP17-SGLT1 correlations in all samples analyzed. Statistical analyses were performed using a 1-way ANOVA. B) Three representative examples of a positive correlation are shown (P1, P2 and P3 are 3 different tumor samples). Two samples of each tumor were stained for MAP17 and SGLT1. C) Magnification is shown of the P3 figures shown in B. Images show the plasma membrane distribution of MAP17 and SGLT1 in the sample tissue sample.

