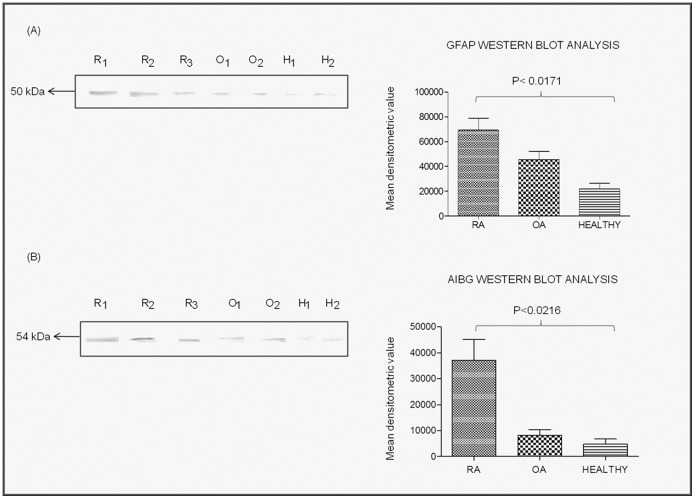
Figure 2. Detection of autoantibodies against purified GFAP and A1BG recombinant proteins in RA patients’ plasma.
The purified GFAP and A1BG recombinant proteins were separated on SDS-PAGE and Western blotted (A) with RA patients’ plasma. Bar diagrams (B) shows the densitometry analysis results and bar represents the mean ± SD of the mean of each spot. Abbreviations: R1, R2 and R3 represent plasma of various RA patients; O1, O2 represents plasma of various OA patents’, H1, H2 represents plasma of various healthy controls.

