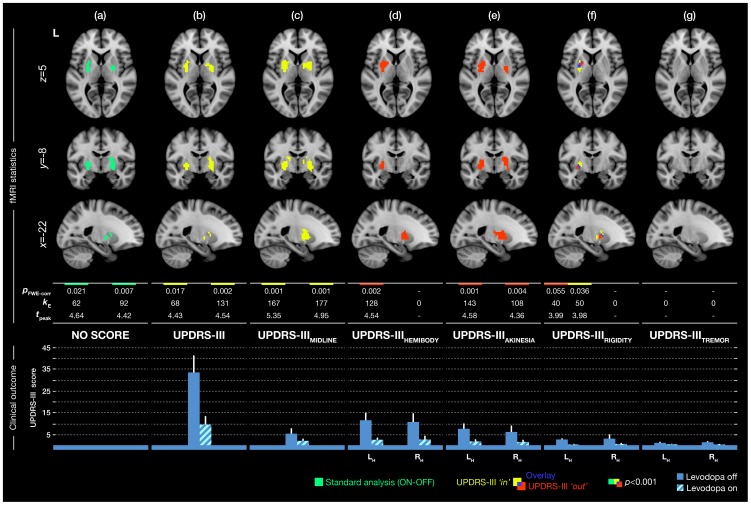
Figure 2. The group response of Parkinson’s disease patients to levodopa, accounting for individual motor aspects of the disease.
First column (a) shows results obtained by a conventional analysis not comprising the UPDRS-III scores. Remaining columns represent results obtained by considering a particular score using UPDRS-III as an explanatory/nuisance variable (UPDRS-III ‘out’, red label) and as the effect of interest to correlate it with the brain responses (UPDRS-III ‘in’, yellow label). The alpha level was set to p<0.001, uncorrected with the cluster extension of k≥30 voxels to correct for multiple tests on the cluster level at the rate of p FWE<0.05. The table displays values obtained by statistical analyses: p FWE-corr: corrected p-value of cluster. k E: number of activated voxels in cluster. t peak: peak t-statistic value in cluster. A value in the table is assigned to a particular cluster in correspondence with its location in the picture (left/right basal ganglia cluster). Bottom bar-plot depicts average of UPDRS-III scores and subscores used in the analyses with standard deviations. LH: left hemibody UPDRS-III score. RH: right hemibody UPDRS-III score.

